









 |
| Gold V.1.3.1 signal Telegram Channel (English) |
USDJPY: Near 40-Year Lows with Key Technical Patterns Indicating Potential Reversal, July 27, 2026
2026-07-27 @ 11:01
Over the past 24 to 48 hours, the USD/JPY currency pair hovered near a four-decade low, with the Japanese yen weakening further to around 163.90 per dollar. The pair closed yesterday at 163.576, down about 0.13% from the previous day, indicating a cautious market amidst ongoing yen weakness. This depreciation was primarily driven by the Bank of Japan’s (BOJ) surprising interest rate hike to 1.25%, which refocused investor attention on the yen’s future trajectory. While the BOJ’s accelerated tightening narrows the US–Japan interest rate gap—typically supportive for the yen—the simultaneous inflation concerns and global uncertainties kept investors favoring the dollar as a safe haven, placing additional pressure on the yen.
Moreover, news of Japan’s massive pension fund GPIF potentially repatriating foreign assets added to the selling pressure on the yen, as the inflow of funds back to Japan likely boosts demand for dollars against yen. Rising oil prices and escalating Middle East geopolitical risks have also strengthened the dollar, further undermining the yen’s performance. For everyday investors, this means holding yen-denominated assets carries exchange rate risk, but leveraging the dollar’s strength could be beneficial for portfolio adjustments and hedging. Overall, market participants remain highly vigilant about upcoming BOJ policy moves and international developments, which will be pivotal in defining USD/JPY’s direction going forward.
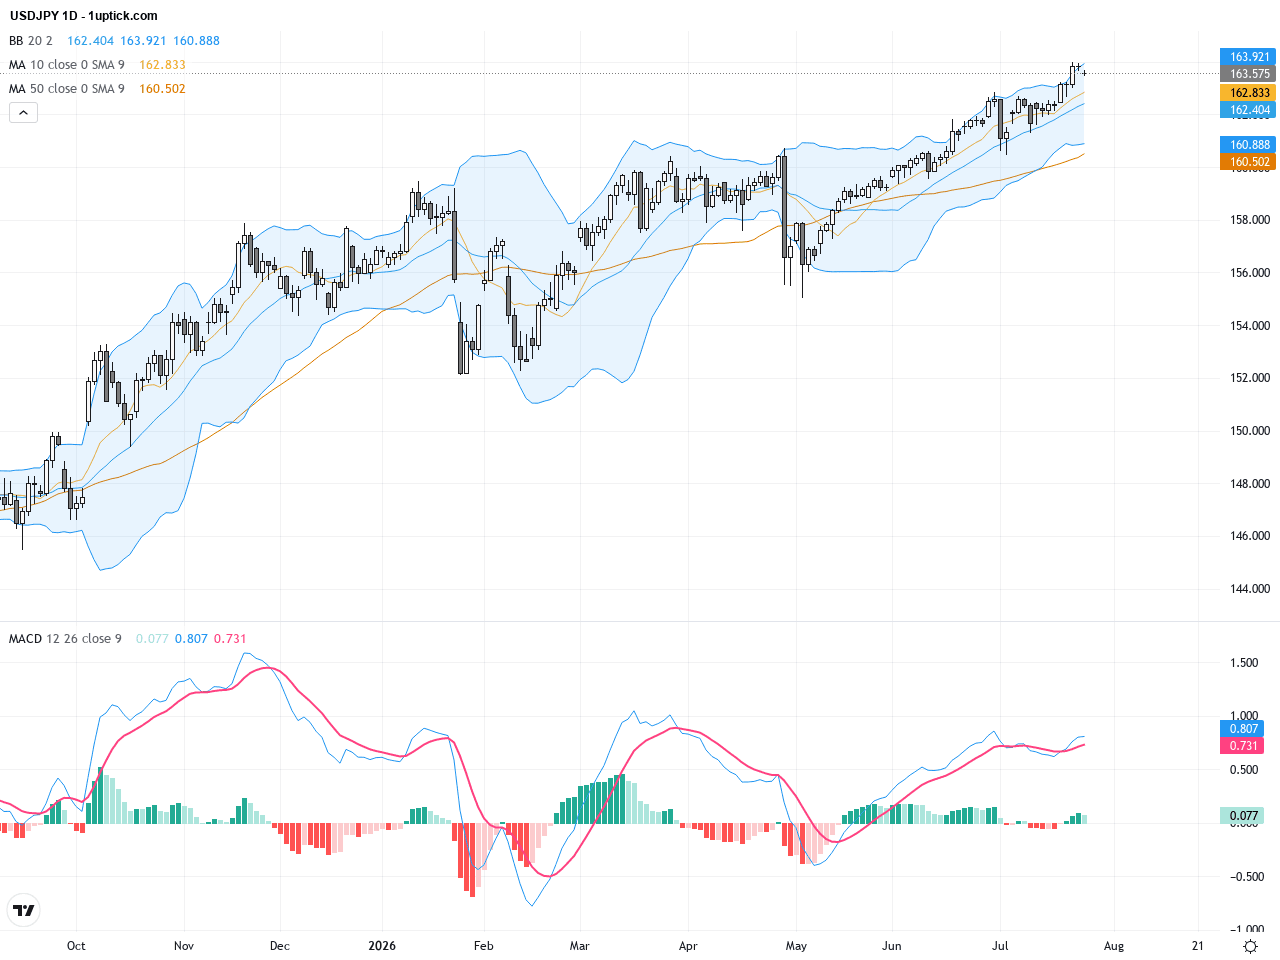
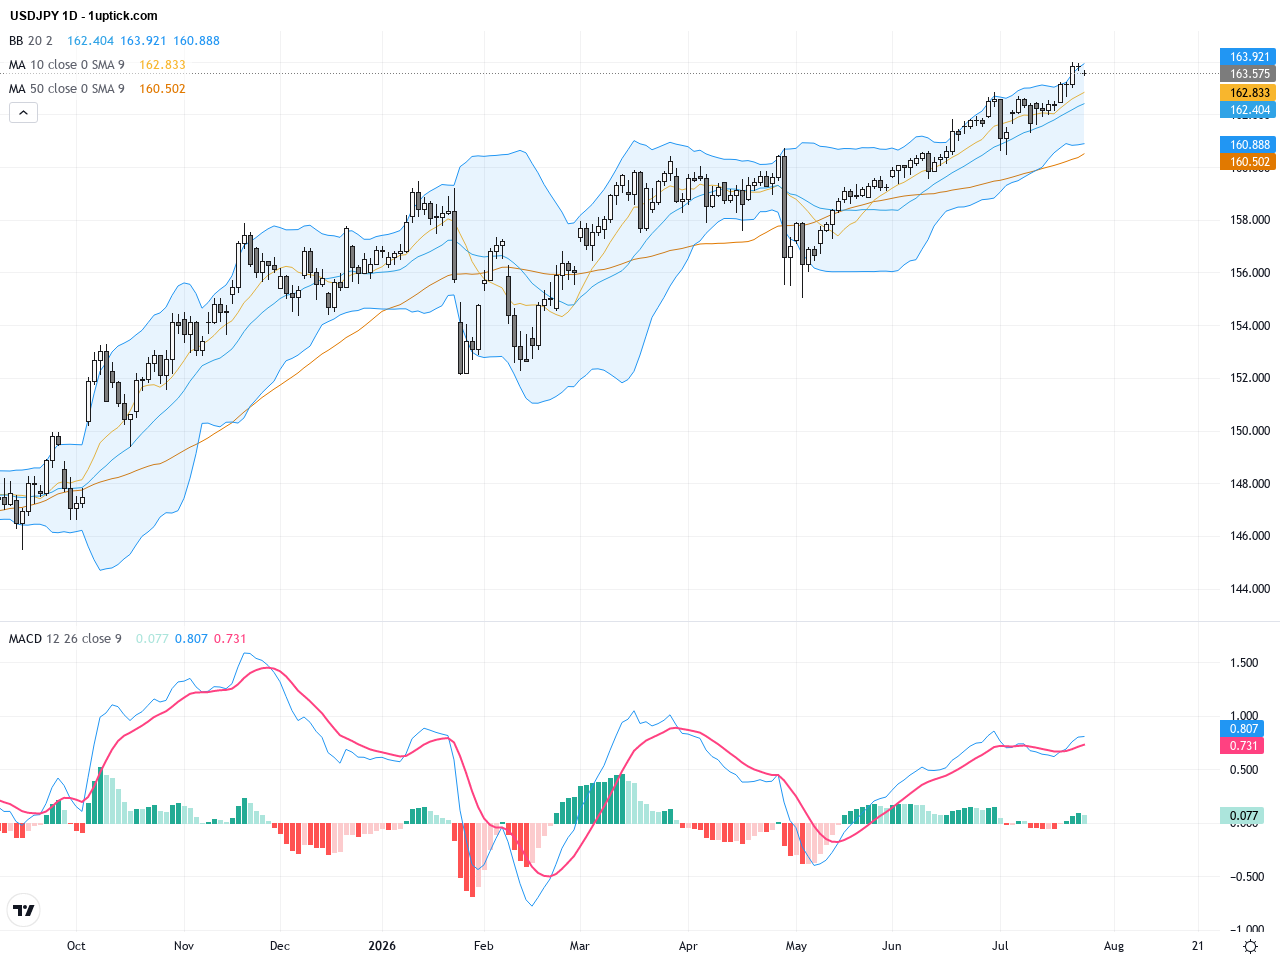
The daily chart shows a sustained downtrend for USDJPY, especially since early 2026, with strong resistance formed around 163.5 to 164. Bollinger Bands have widened, reflecting increased volatility, while the gap between the 50-day and 200-day moving averages indicates ongoing bearish momentum. The MACD remains below its signal line, confirming a weak trend. Overall, the long-term technical posture remains bearish though prices near historic lows suggest a possible bounce.
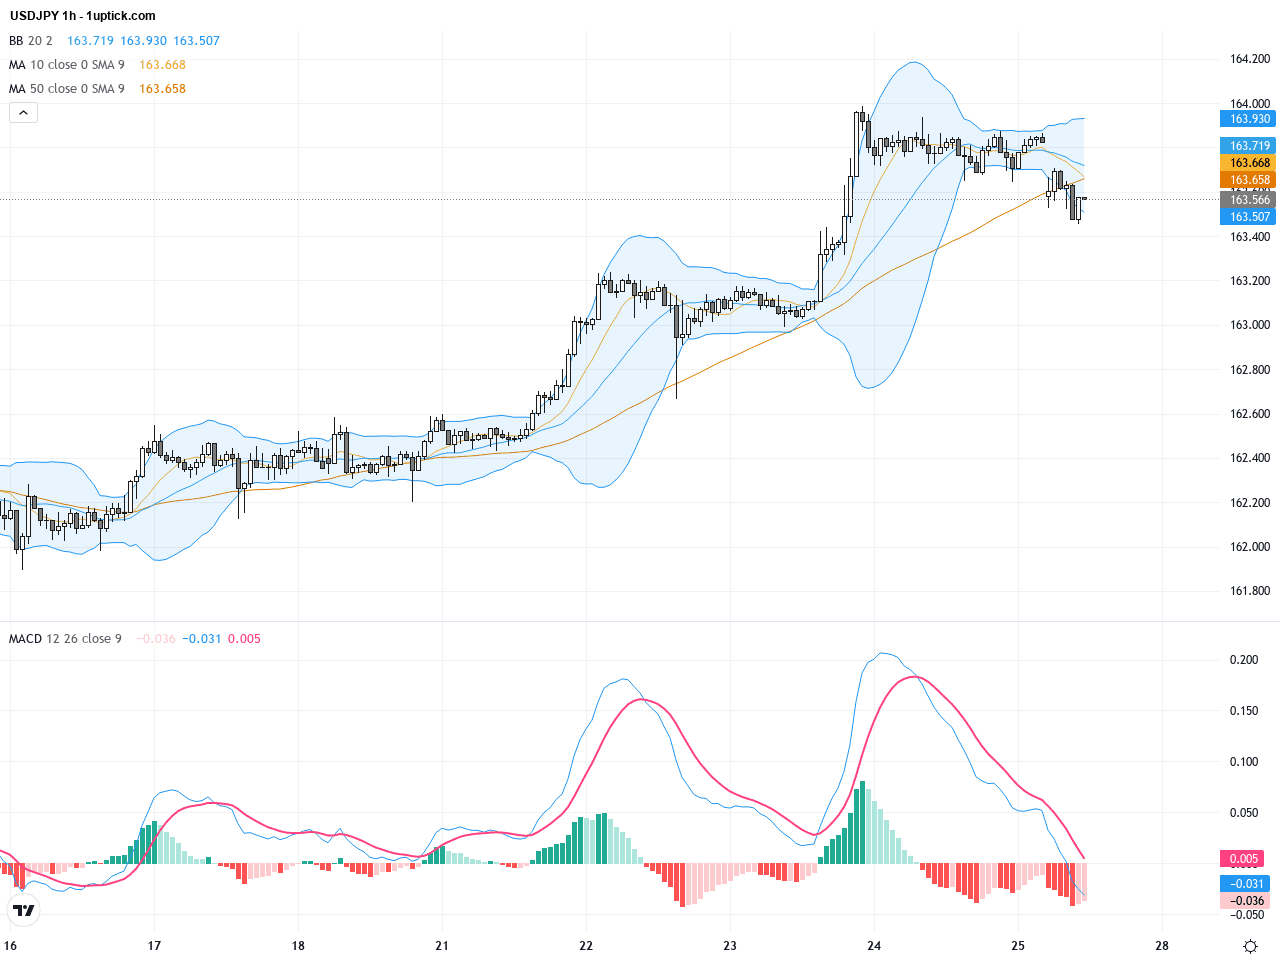
The last 3-5 days on the hourly chart reveal multiple support tests near current lows with Bollinger Bands narrowing, indicating consolidation. The 21 EMA is rising, and a MACD bullish crossover is in formation, signaling a potential short-term rebound. However, market sentiment remains cautious, and failure to break above resistance could lead to renewed downside pressure.
Technical Trend: The current trend is cautiously bearish, with a clear long-term downtrend on the daily timeframe and consolidation with minor short-term rebounds observed on hourly charts.
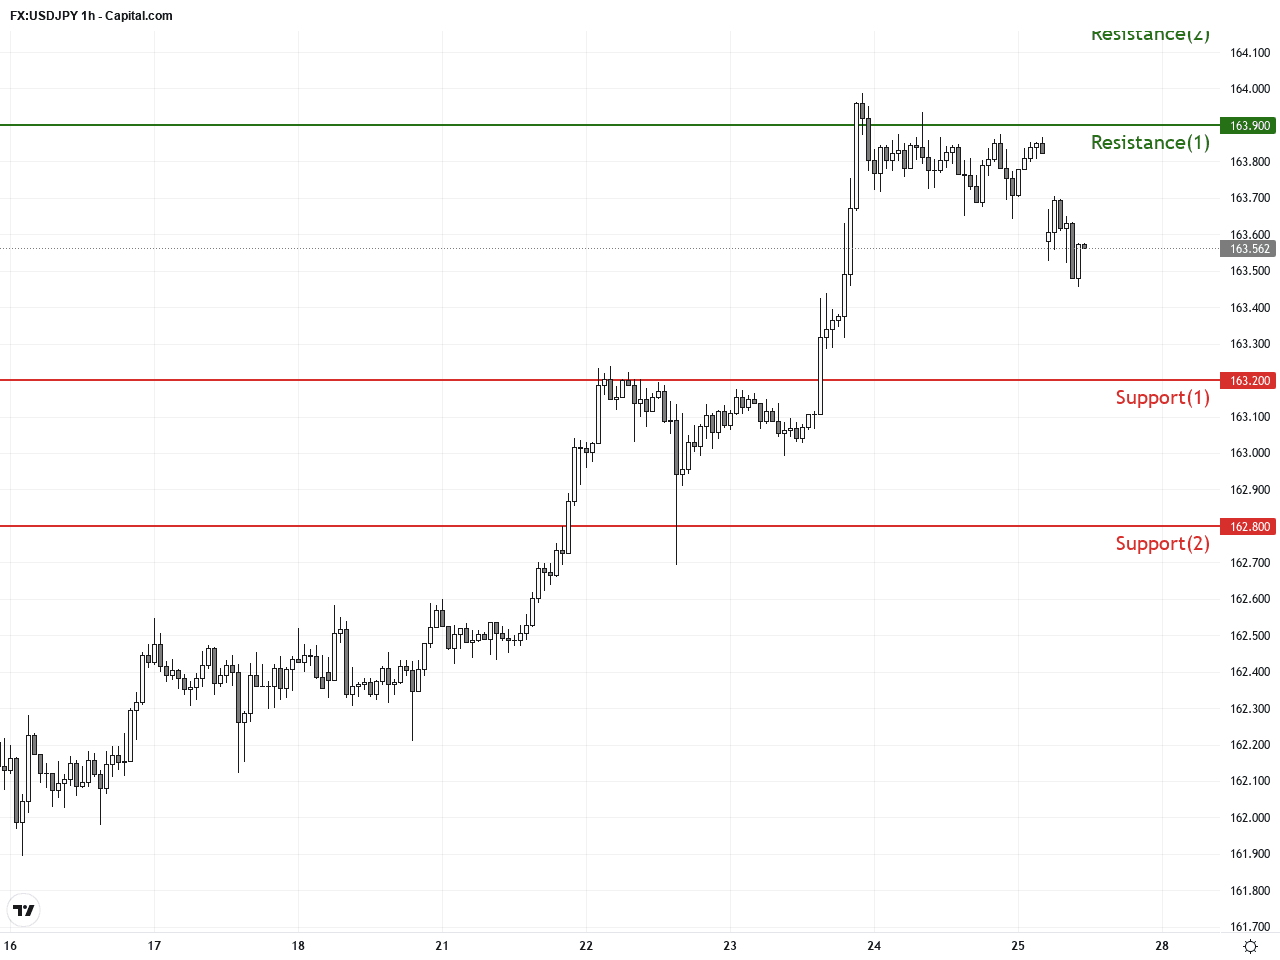
The key technical takeaway is the coexistence of a strong bearish trend on the daily chart and a short-term bullish momentum appearing on the hourly chart. The MACD bullish crossover could fuel a brief rally while expanded Bollinger Bands warn of heightened volatility. Critical resistance lies at 163.9 and 164.2—breaching these could support a short-term upswing, whereas a drop below 163.2 may open the door to further decline. Prudent risk management strategies are advised amid this volatility.Today’s GMT+1 economic calendar does not include any major data directly impacting USDJPY. Key releases include the Eurozone Ifo Business Climate and US Durable Goods Orders; stronger US numbers could ultimately strengthen the dollar and affect USDJPY indirectly. However, no immediate direct impact is expected from today’s events.
Resistance & Support
The above financial market data, quotes, charts, statistics, exchange rates, news, research, analysis, buy or sell ratings, financial education, and other information are for reference only. Before making any trades based on this information, you should consult independent professional advice to verify pricing data or obtain more detailed market information. 1uptick.com should not be regarded as soliciting any subscriber or visitor to execute any trade. You are solely responsible for all of your own trading decisions.