
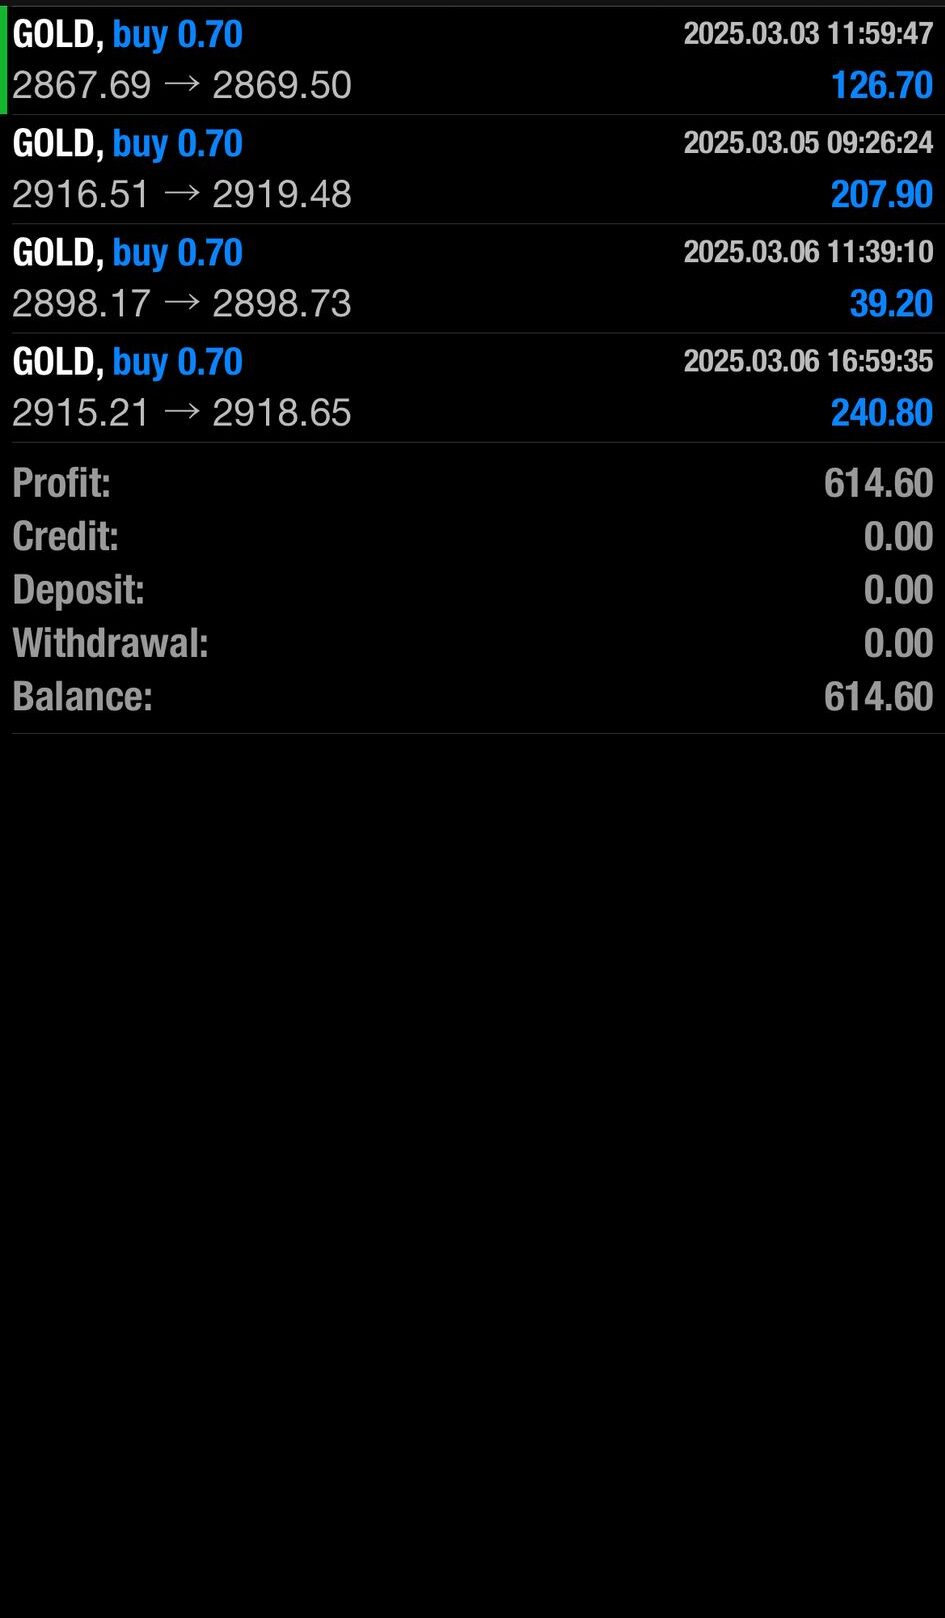
MAR. Week 1
+US$614.60 2025.3.3-2025.3.7
+US$614.60 2025.3.3-2025.3.7

Price Movement The daily chart of the S&P depicts a fluctuating trend with periods of both bullish and bearish sentiment. Initially, there is a significant uptrend, indicated by a series of higher highs and higher lows, sustaining above the green upward channel. As the chart progresses, the price encounters resistance around the 45,180 level, subsequently […]
Price Movement The EUR/USD daily chart shows prolonged bearish movement followed by a consolidation period. Initially, the pair experienced a significant downward trend as indicated by consecutive lower lows and lower highs. A reversal was attempted, but resistance around the 1.0500-1.0530 range halted further upward movement. Throughout the period under consideration, the price oscillated within […]
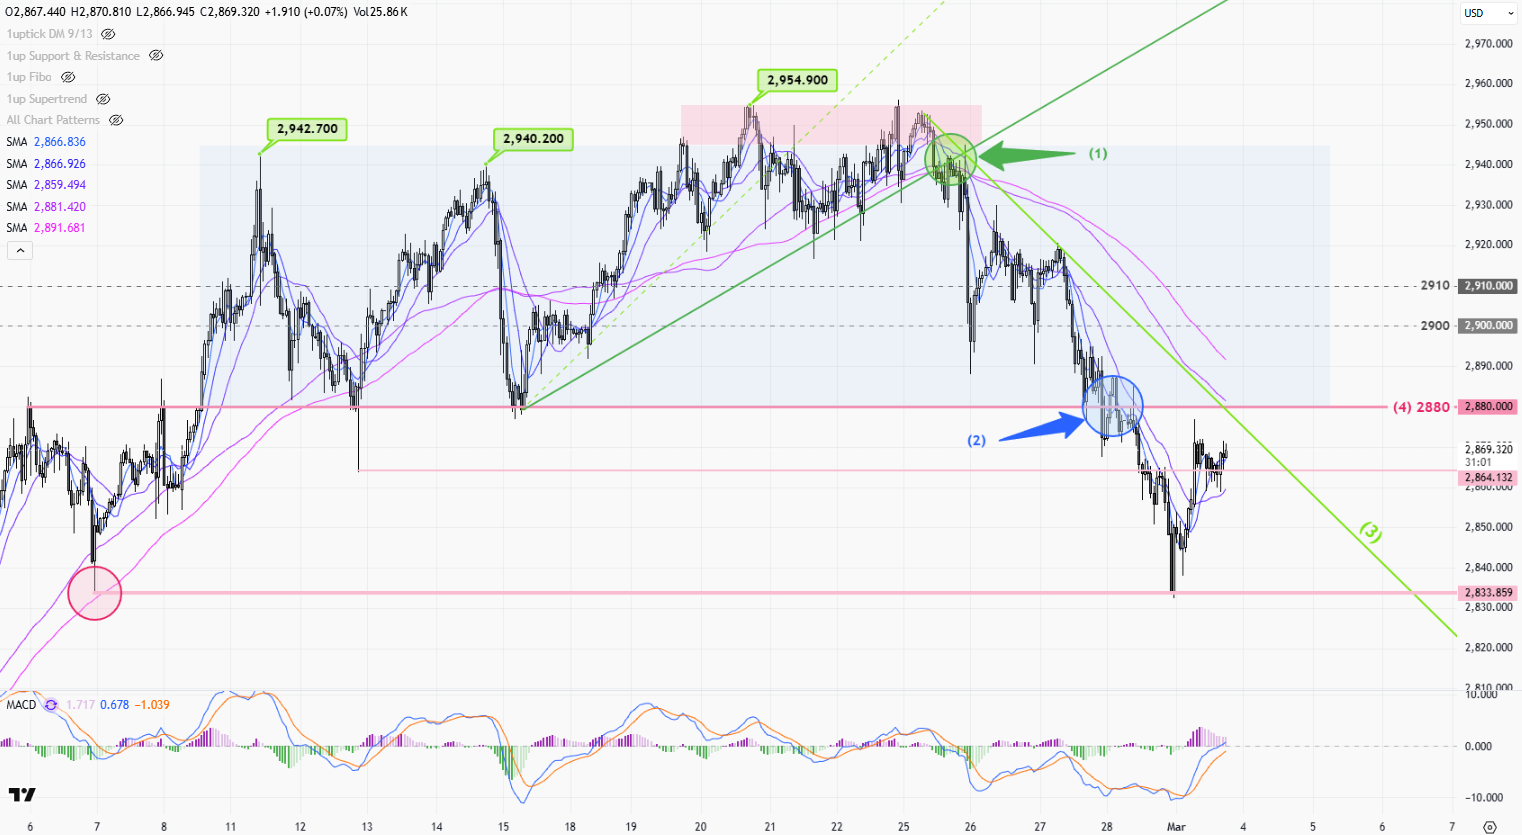
Gold prices continue to fluctuate near record highs. Early last week, the market was again driven by uncertainty over Trump’s tariff policy, hitting a new high of 2942. It was pushed toward 2863 by stronger-than-expected US inflation data on Wednesday, but the price rebounded quickly to 2940 before the U.S. session on Friday. As the peace talks began between Russia and the US, the geopolitical situation eased, profit taking/short-selling hit the market where the gold prices closed below 2900 near 2880.
The gold market will still be under the influence of Trump’s new economic policy this week. However, unless a more aggressive policy is introduced, the market is starting to adapt to the current market condition after nearly four weeks of news turmoil. With the prospect of a truce between Russia and Ukraine, it should be difficult for gold prices to hit a new high in the short term.
>
1-hr chart(above) > Monday is a U.S. holiday, the price should be bounded by the range of 2780-2910 (1). Later this week, a wider range can be expected between 2865-and 2942, and wait for the breakout before the next round of major trends.
>
Daily chart(above) > The 10-day moving average (3) dip-buying strategy mentioned last week is still valid. Note that last Friday’s sharp one-day pullback reflects the bear is starting to take control of the market, and it is important to be careful of a significant correction in the market this week. The breakout of the 10 days MA(3) will be the start of a bearish trend on the daily chart.
P. To
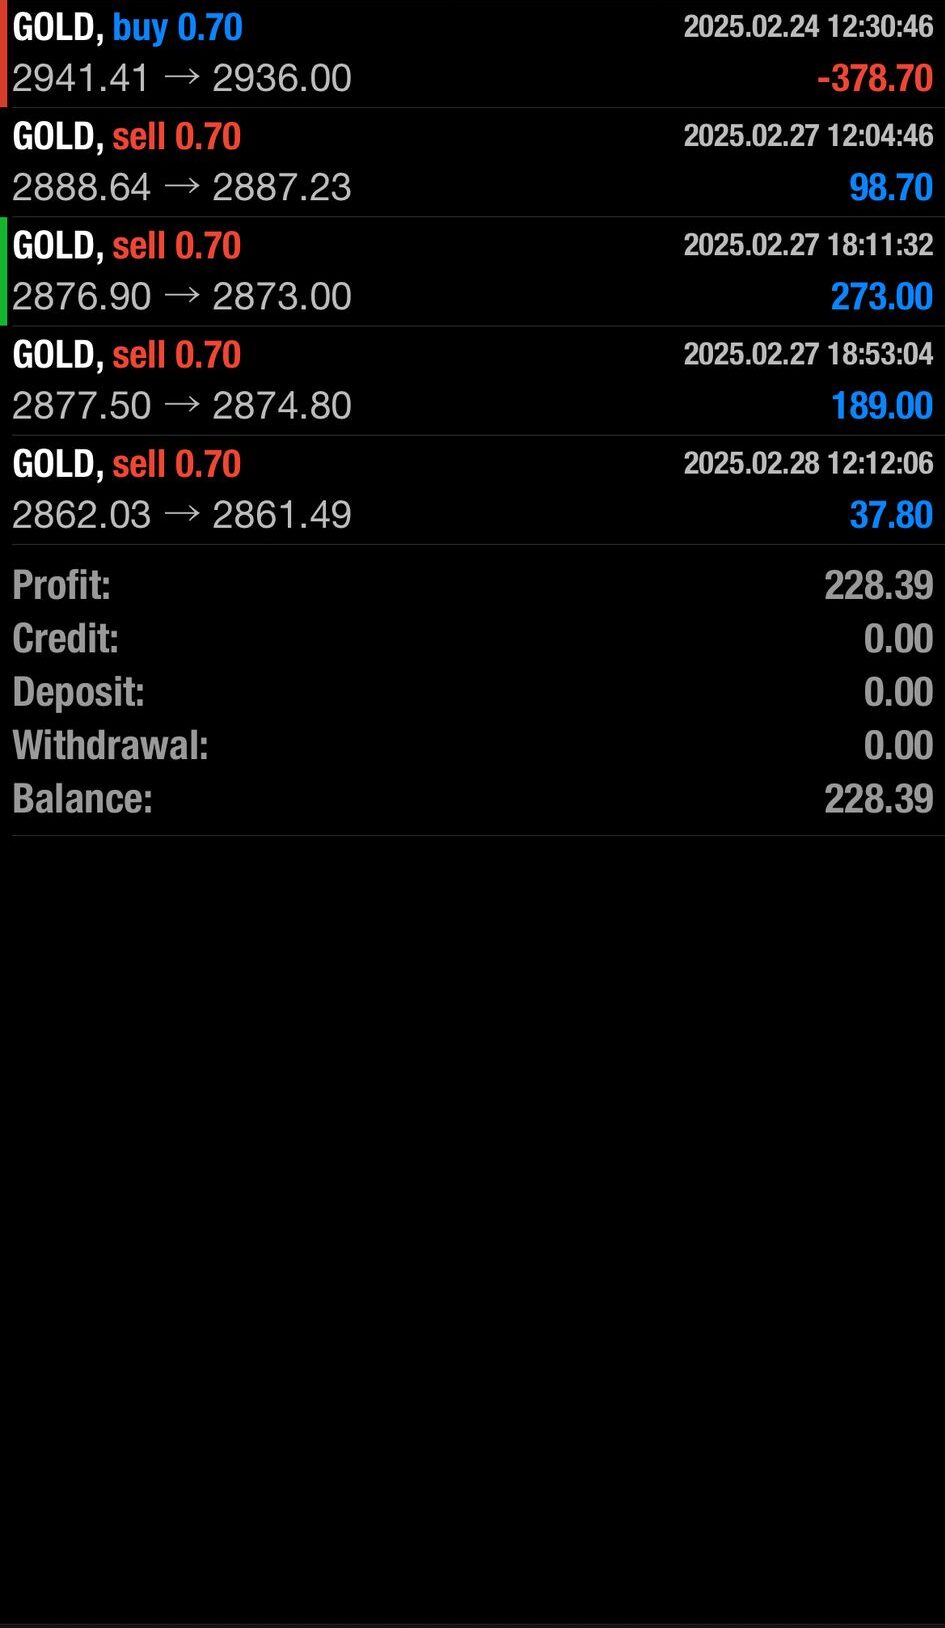
+US$228.39 2025 2.24-2025.2.28
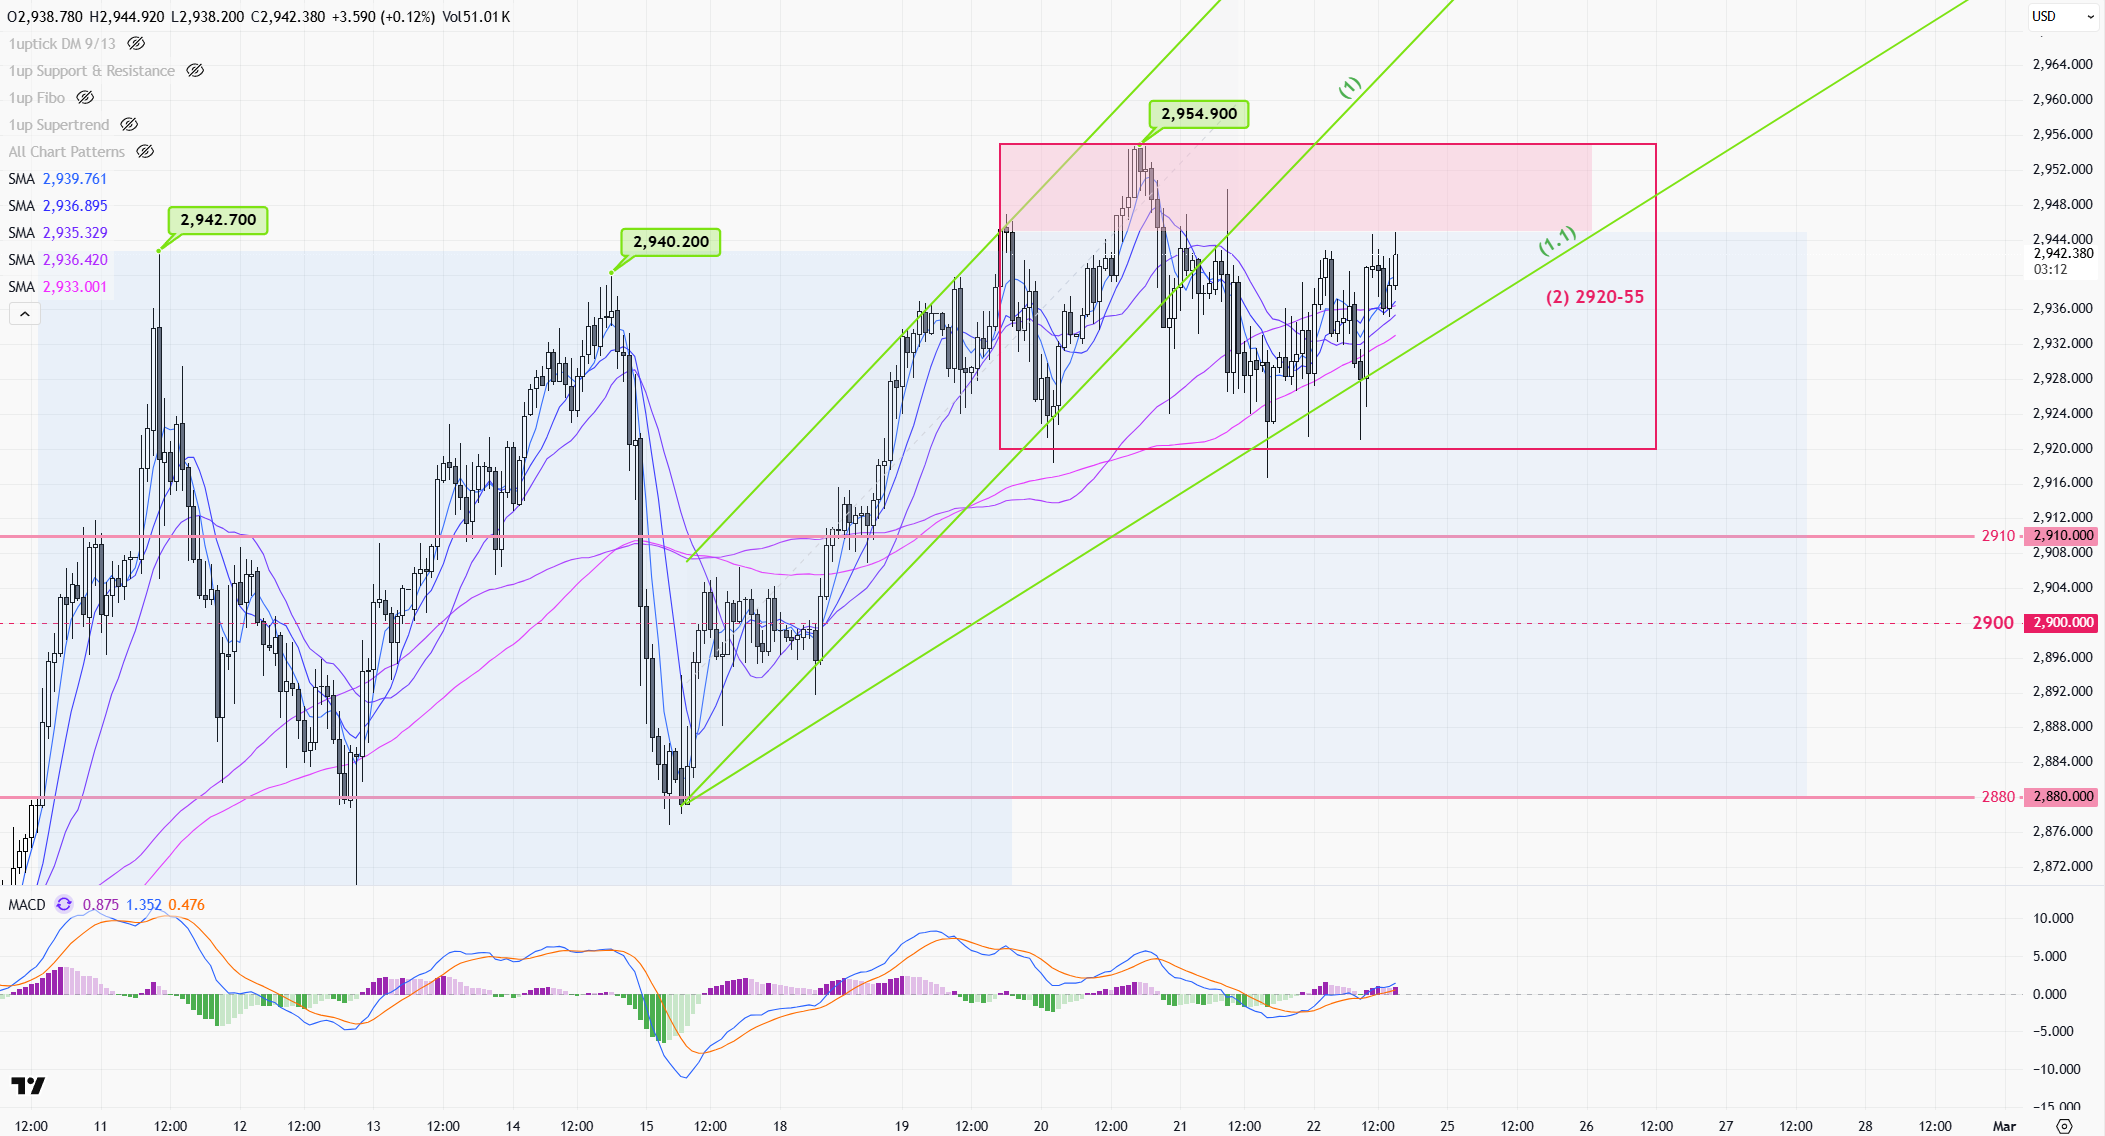
Gold prices continue to fluctuate near record highs. Early last week, the market was again driven by uncertainty over Trump’s tariff policy, hitting a new high of 2942. It was pushed toward 2863 by stronger-than-expected US inflation data on Wednesday, but the price rebounded quickly to 2940 before the U.S. session on Friday. As the peace talks began between Russia and the US, the geopolitical situation eased, profit taking/short-selling hit the market where the gold prices closed below 2900 near 2880.
The gold market will still be under the influence of Trump’s new economic policy this week. However, unless a more aggressive policy is introduced, the market is starting to adapt to the current market condition after nearly four weeks of news turmoil. With the prospect of a truce between Russia and Ukraine, it should be difficult for gold prices to hit a new high in the short term.
>
1-hr chart(above) > Monday is a U.S. holiday, the price should be bounded by the range of 2780-2910 (1). Later this week, a wider range can be expected between 2865-and 2942, and wait for the breakout before the next round of major trends.
>
Daily chart(above) > The 10-day moving average (3) dip-buying strategy mentioned last week is still valid. Note that last Friday’s sharp one-day pullback reflects the bear is starting to take control of the market, and it is important to be careful of a significant correction in the market this week. The breakout of the 10 days MA(3) will be the start of a bearish trend on the daily chart.
P. To
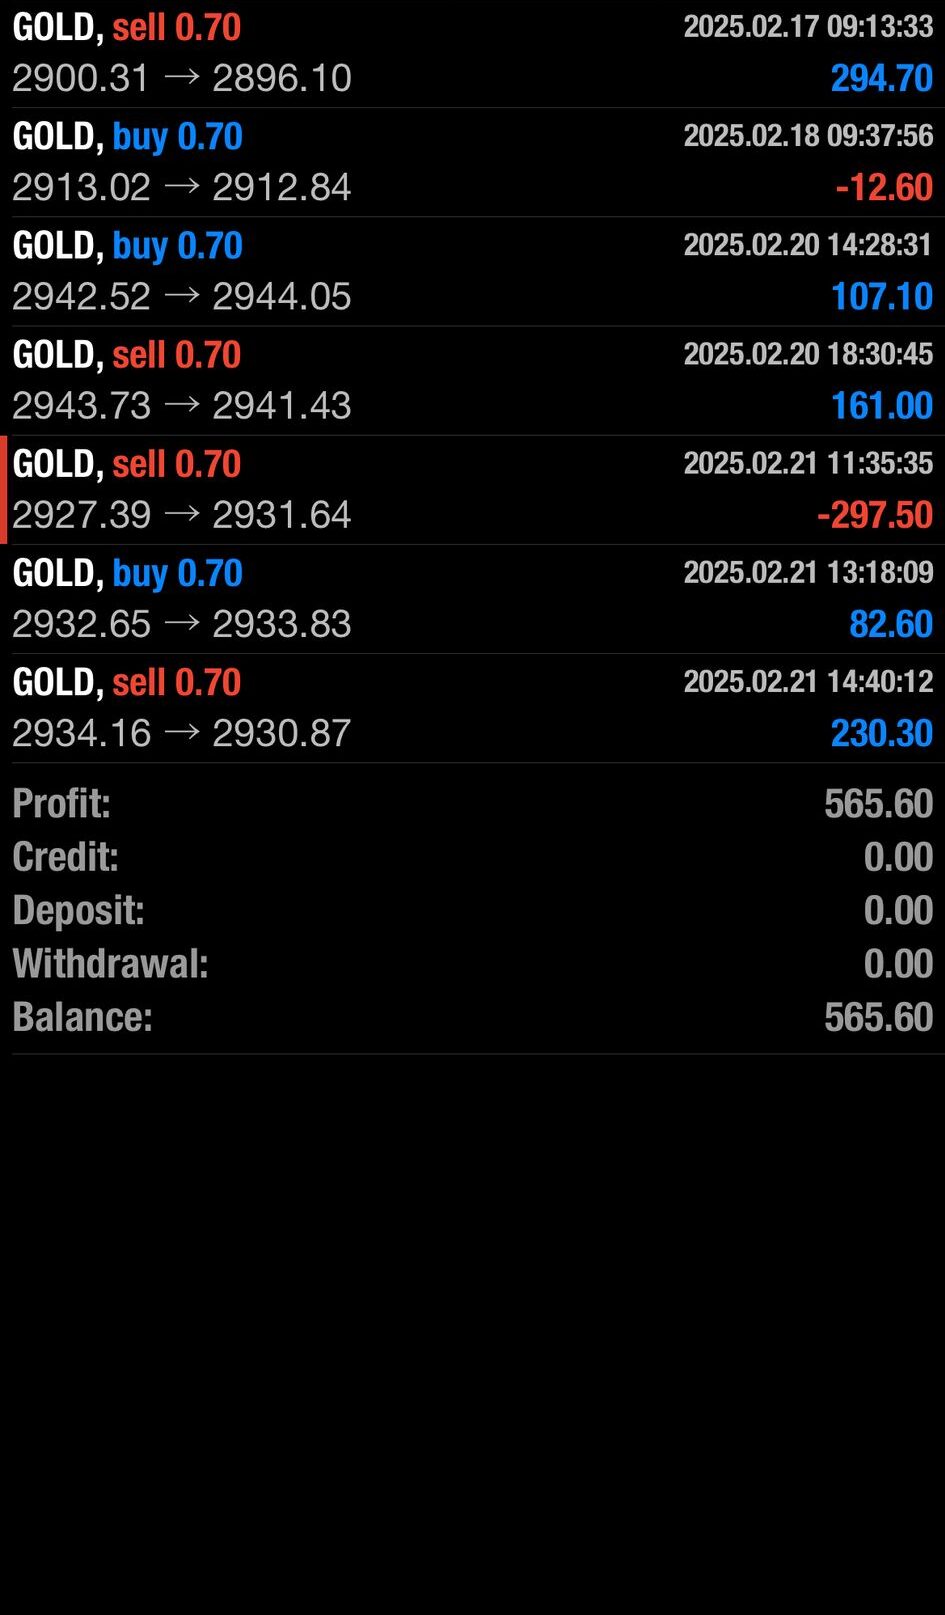
+US$565.60 2025 2.17-20252.21
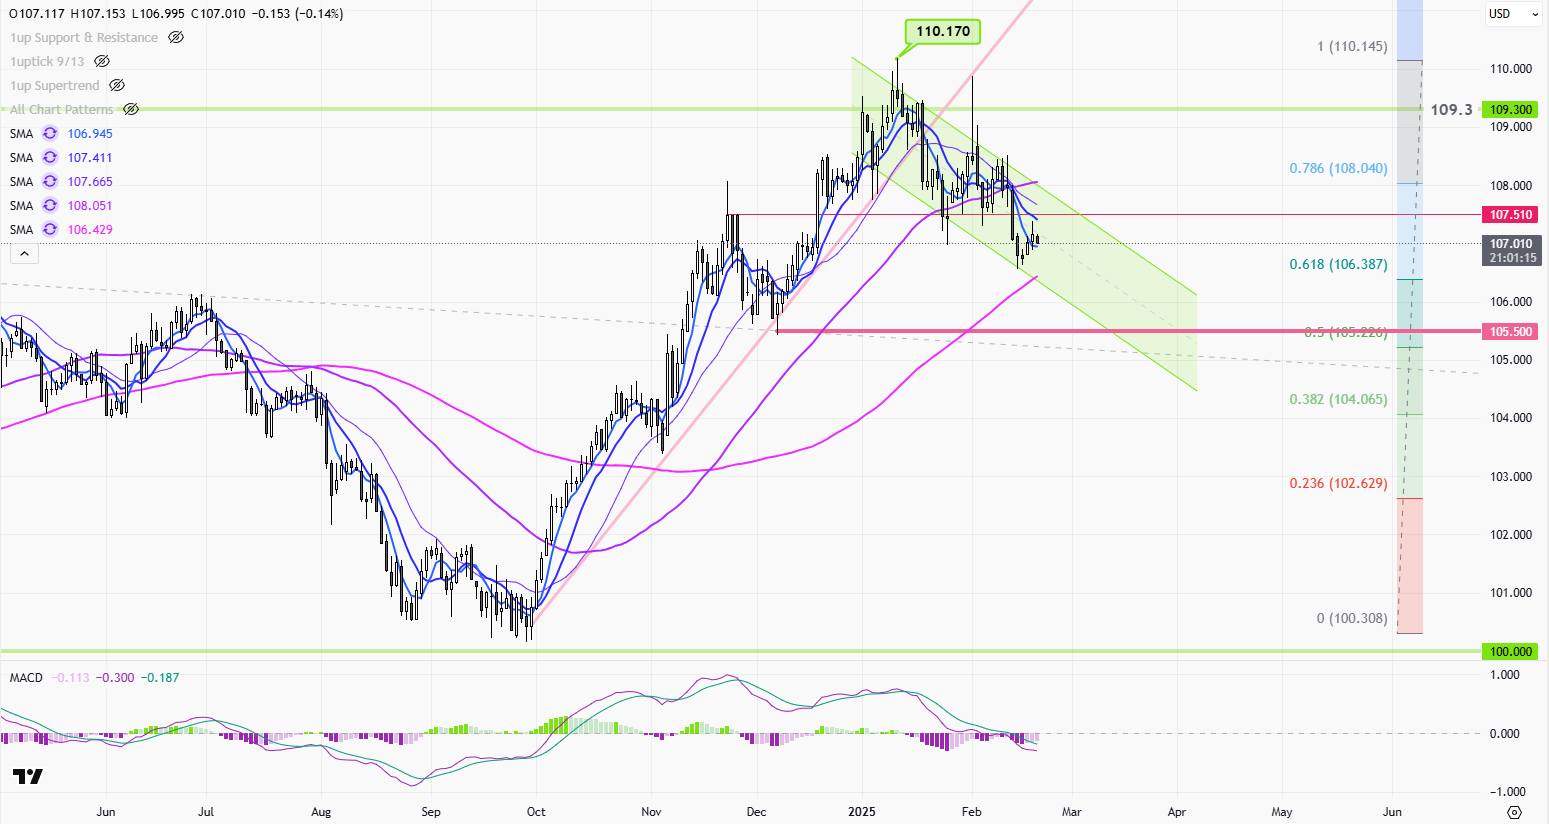
Price Movement The USD Index daily chart shows a recent period of volatility with notable price shifts. Initially, the index experienced an upward trend, reaching a peak near 110.170. This rise was followed by a pullback, as sellers gained control, leading to increased bearish sentiment. The chart indicates a series of lower highs and lower […]
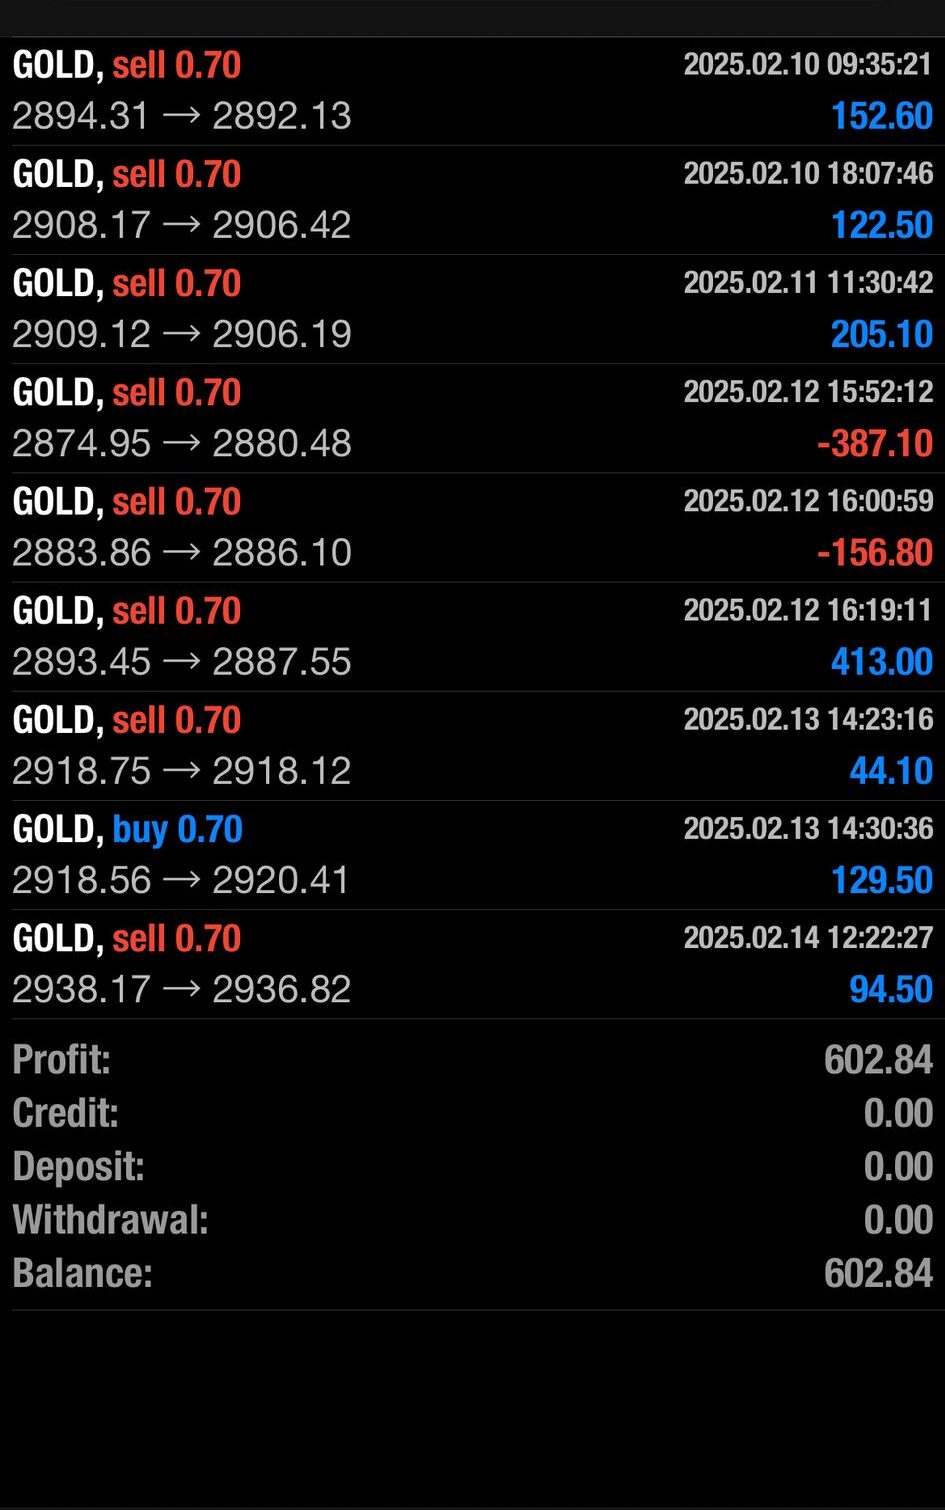
+US$602.87
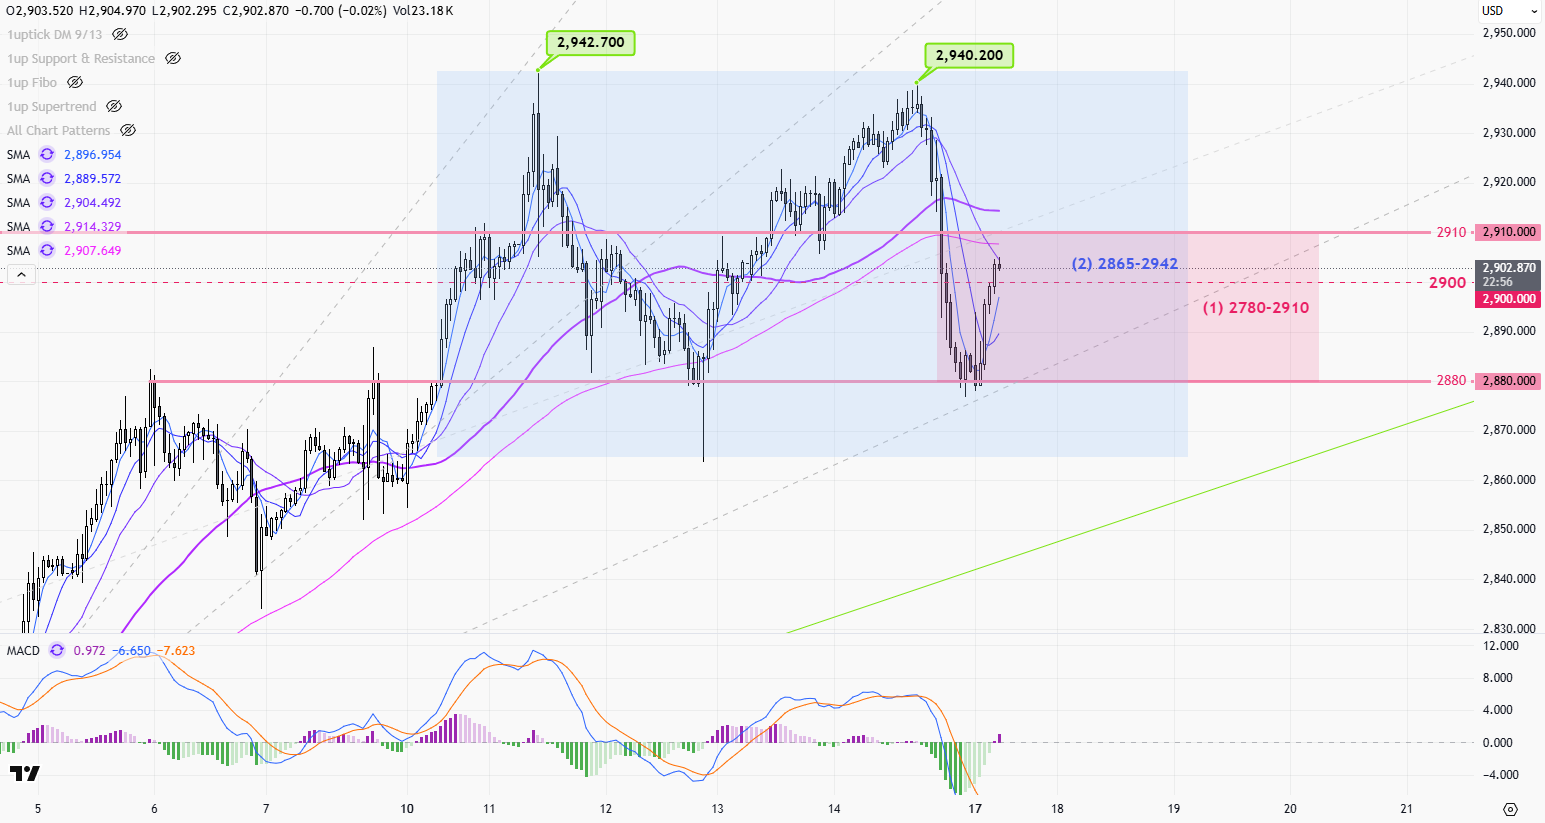
Gold prices continue to fluctuate near record highs. Early last week, the market was again driven by uncertainty over Trump’s tariff policy, hitting a new high of 2942. It was pushed toward 2863 by stronger-than-expected US inflation data on Wednesday, but the price rebounded quickly to 2940 before the U.S. session on Friday. As the peace talks began between Russia and the US, the geopolitical situation eased, profit taking/short-selling hit the market where the gold prices closed below 2900 near 2880.
The gold market will still be under the influence of Trump’s new economic policy this week. However, unless a more aggressive policy is introduced, the market is starting to adapt to the current market condition after nearly four weeks of news turmoil. With the prospect of a truce between Russia and Ukraine, it should be difficult for gold prices to hit a new high in the short term.
>
1-hr chart(above) > Monday is a U.S. holiday, the price should be bounded by the range of 2780-2910 (1). Later this week, a wider range can be expected between 2865-and 2942, and wait for the breakout before the next round of major trends.
>
Daily chart(above) > The 10-day moving average (3) dip-buying strategy mentioned last week is still valid. Note that last Friday’s sharp one-day pullback reflects the bear is starting to take control of the market, and it is important to be careful of a significant correction in the market this week. The breakout of the 10 days MA(3) will be the start of a bearish trend on the daily chart.
P. To

 |
| Gold V.1.3.1 signal Telegram Channel (English) |