Category: gold

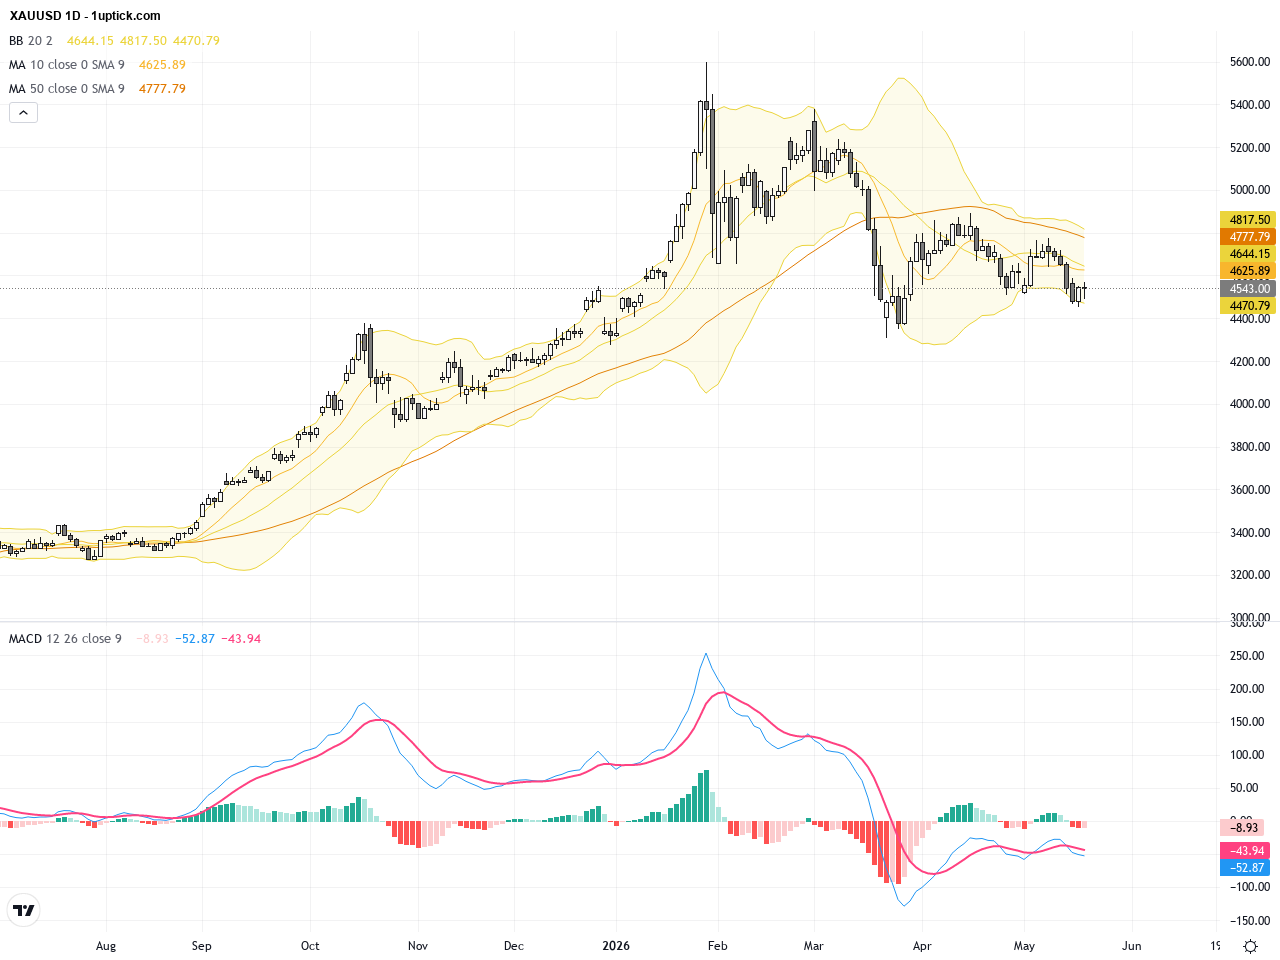
XAUUSD: Dollar Rally Pressures Gold at Key Support Levels, May 15, 2026

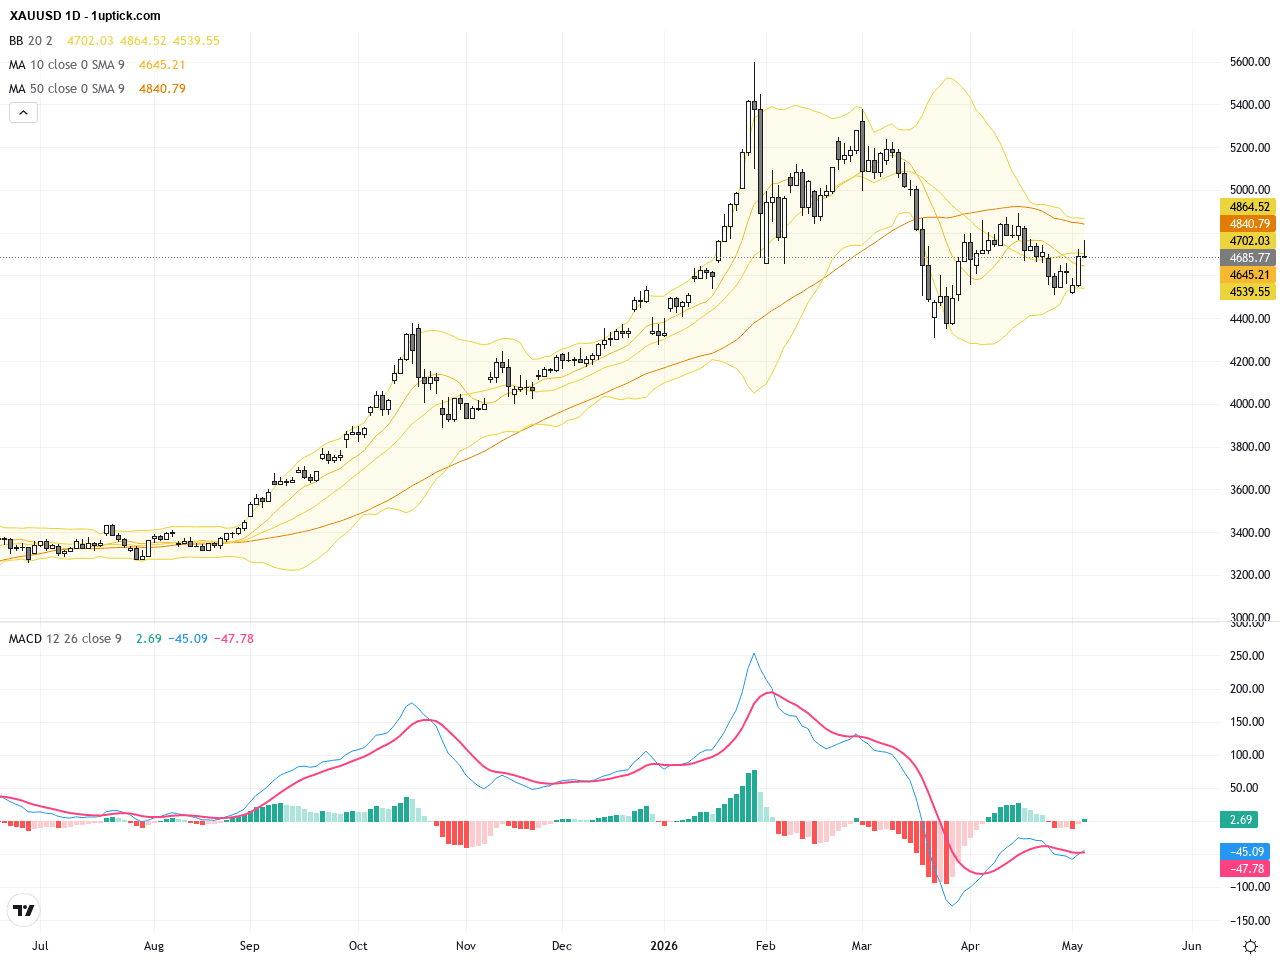
Over the past three trading days, XAUUSD (Gold vs USD) has experienced significant volatility, falling from highs near 4715 down to a close around 4650 yesterday, marking notable declines. The market mood has been driven by a four-day dollar rally fueled by hotter-than-expected US inflation data, which has dimmed hopes for Fed rate cuts. This strong USD trend pressured gold prices, causing investors to reduce gold holdings amid diminished safe-haven appeal. For typical investors, this signals the need to watch whether gold can hold key support levels, which will affect confidence in gold as a portfolio asset. The coming days will be crucial for gold’s price direction.

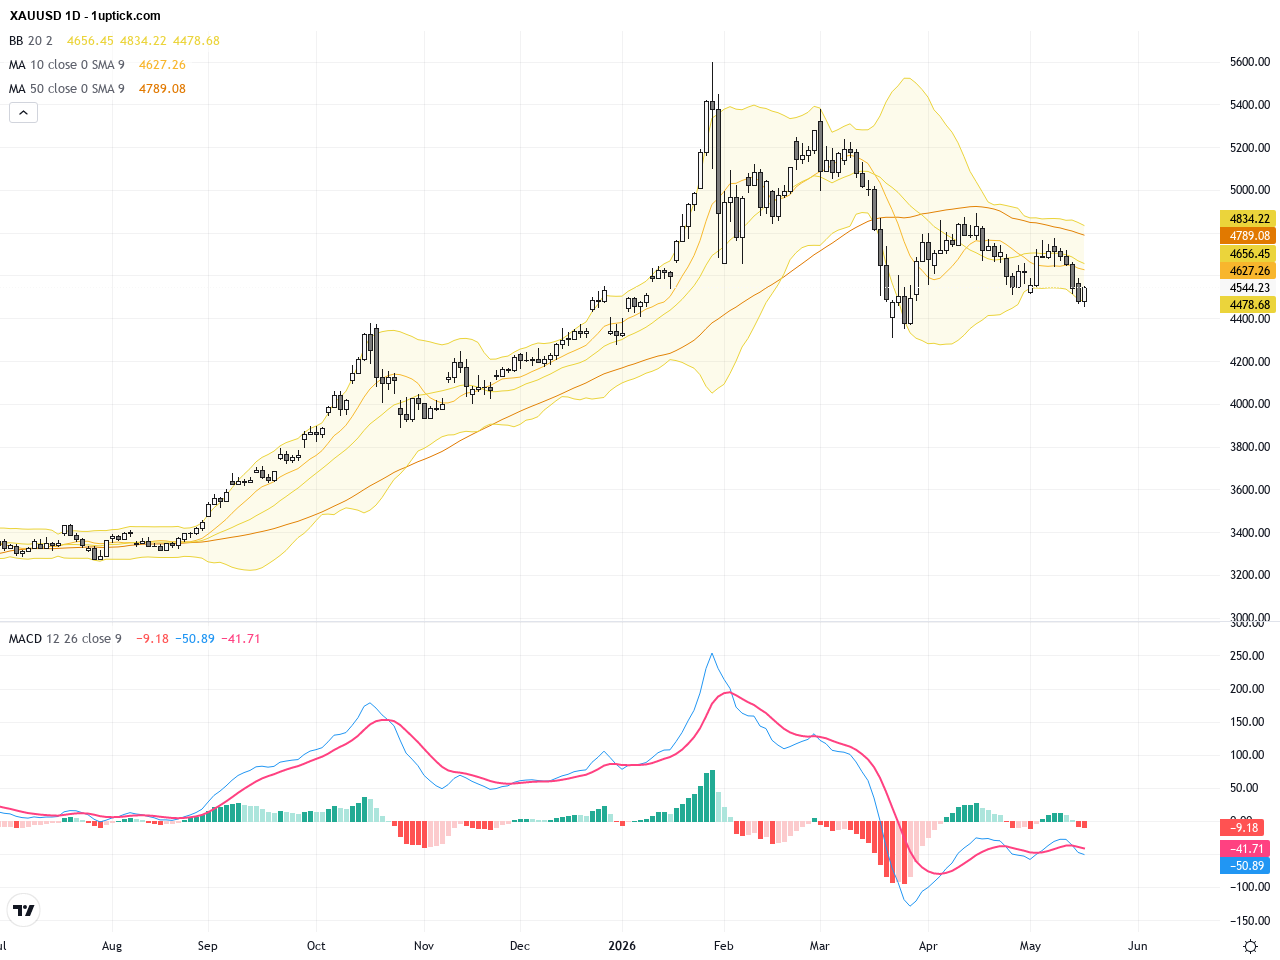
XAUUSD Gold Price Analysis: Facing Strong Resistance at Key Moving Averages, Trading Outlook and Critical Levels, May 14, 2026

Over the past three trading days, XAUUSD gold prices have seen high volatility, declining from a high of 4735.455 to yesterday’s close at 4689.31. The market digests U.S. inflation data and ongoing Middle East geopolitical tensions. Recent news highlights a strong pullback influenced by rising silver prices and a firmer dollar, with the 20-day and 50-day moving averages acting as significant resistance levels. Investors should watch the gold-to-silver ratio and the U.S. core Producer Price Index (PPI) – these factors will determine near-term price direction. Overall, gold is at a crucial decision point between bulls and bears, with increased volatility signaling the need for cautious trading to manage reversal risks.

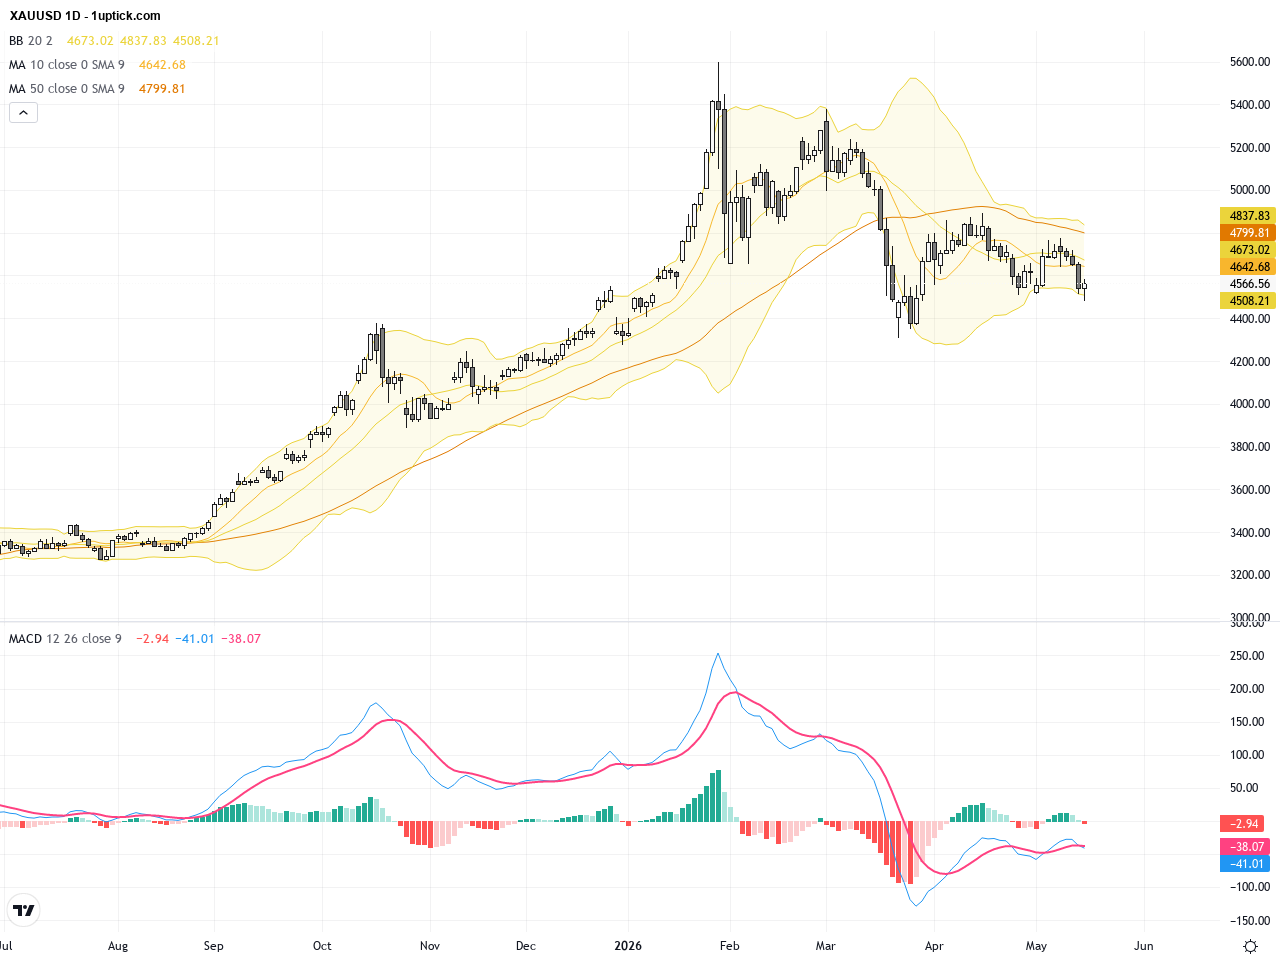
XAUUSD: Gold Eyes Breakout as It Faces Crucial 20-Day and 50-Day Moving Average Resistance, May 12, 2026

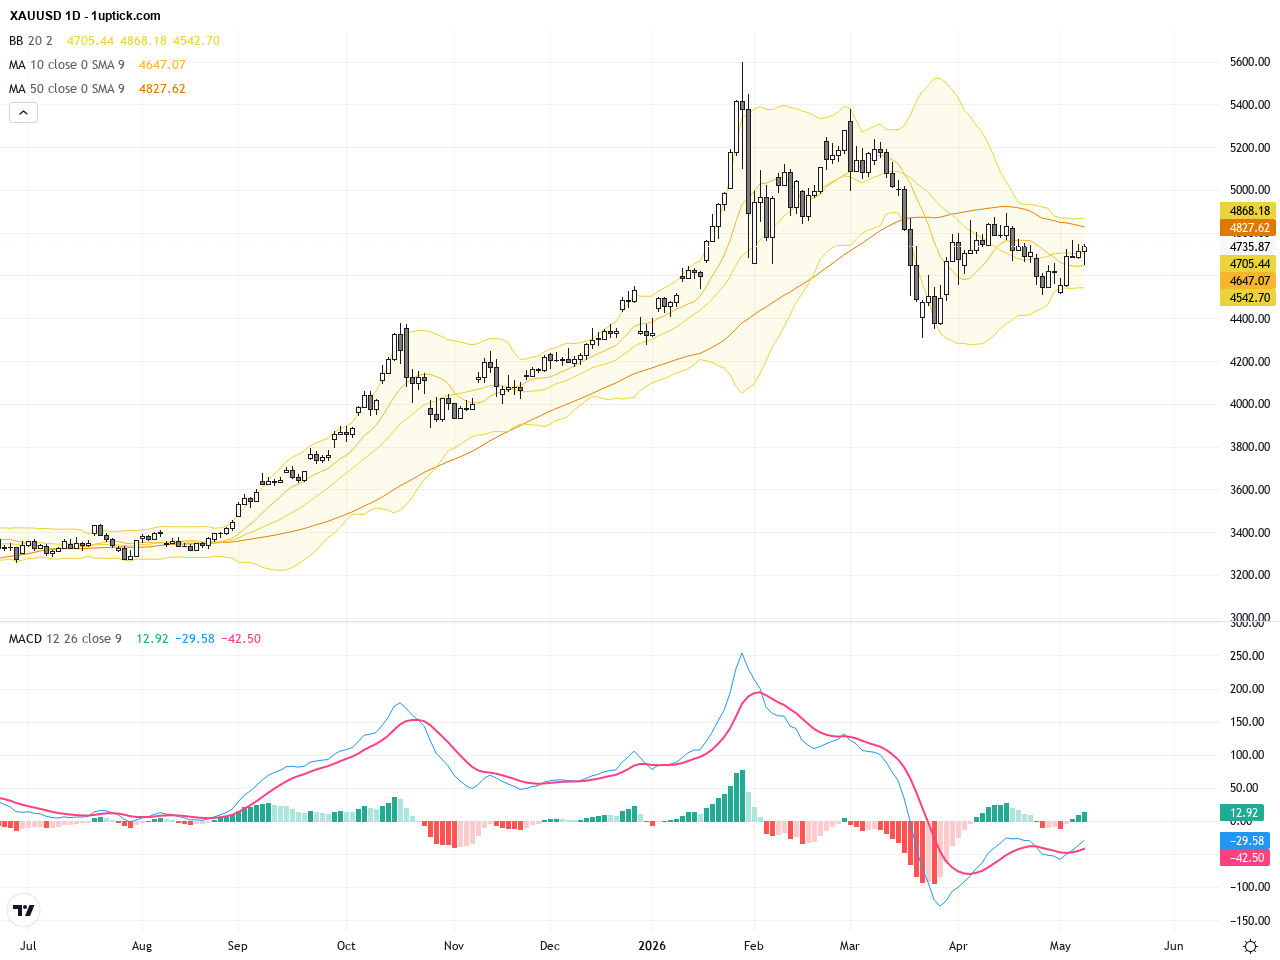
Over the past three trading days, XAUUSD has shown a volatile rebound, closing at 4736.71 yesterday — marking a notable rise from May 10’s close of 4681. This surge was largely driven by falling oil prices, softer U.S. bond yields, and growing anticipation ahead of the upcoming U.S. CPI inflation data release. Meanwhile, easing U.S.-Iran tensions have weakened the dollar’s safe-haven demand, supporting gold prices further. For the average investor, this translates into a buying opportunity on dips but warrants caution due to potential sharp moves around critical economic disclosures. The short-term outlook remains cautiously optimistic with a focus on key technical resistance levels and fundamental catalysts.

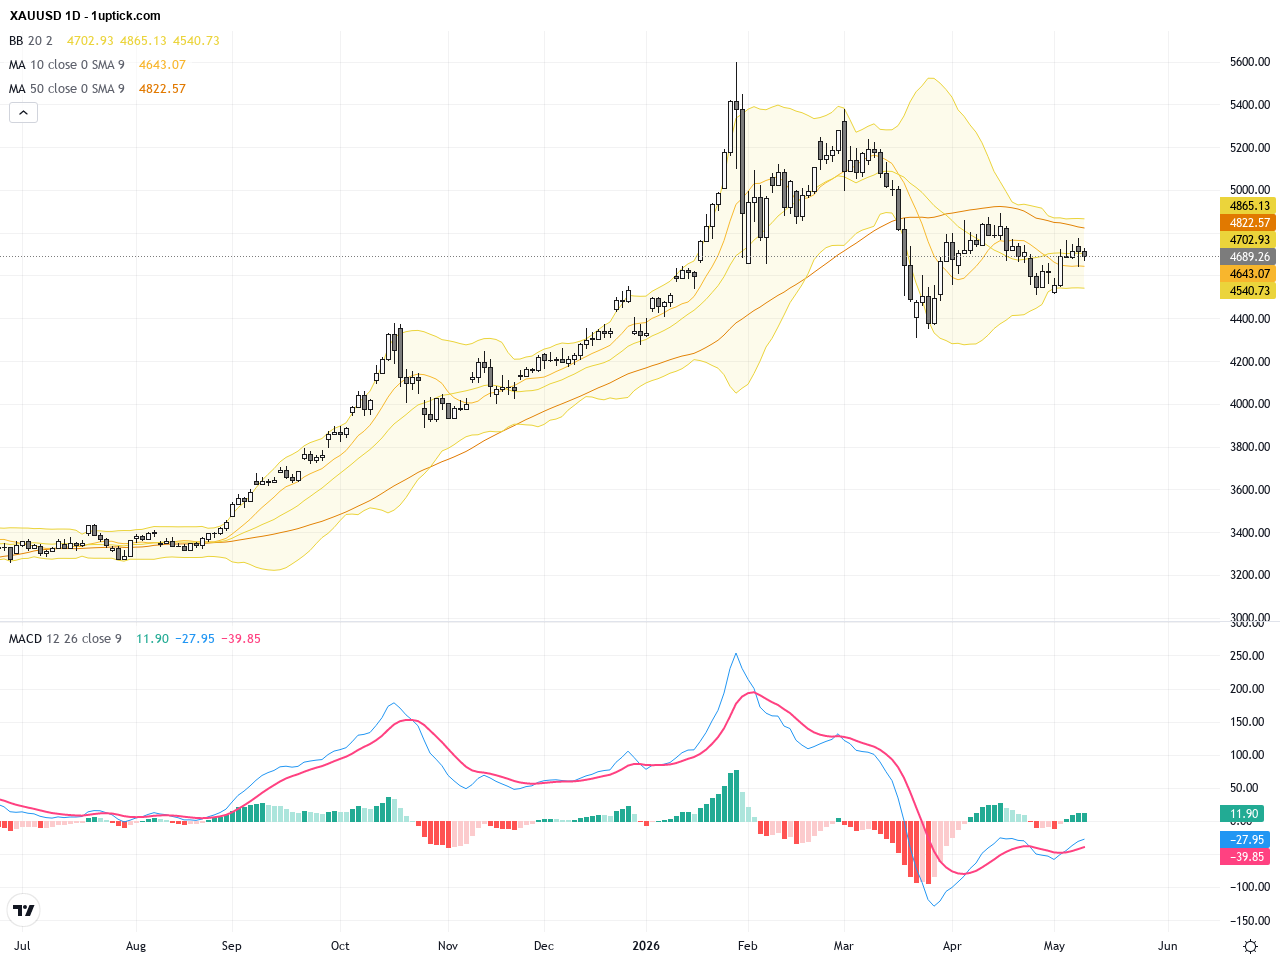
XAUUSD: Gold Breaks Above 20 & 50-Day Moving Averages, Signaling Strong Technical Rally, May 9, 2026

XAUUSD has experienced significant volatility over the past three trading days. After hovering around 4690 on May 6, gold prices surged to close above 4700 on May 7, reaching highs near 4764. This rally is largely driven by a weakening US dollar and falling oil prices, alongside optimism surrounding US-Iran peace talks. For investors, these factors translate to increased safe-haven demand, positioning gold as a preferred refuge amid geopolitical uncertainties. The technical momentum suggests short-term bullishness, with the crucial US nonfarm payrolls report on the horizon potentially serving as a key catalyst for the next market move.

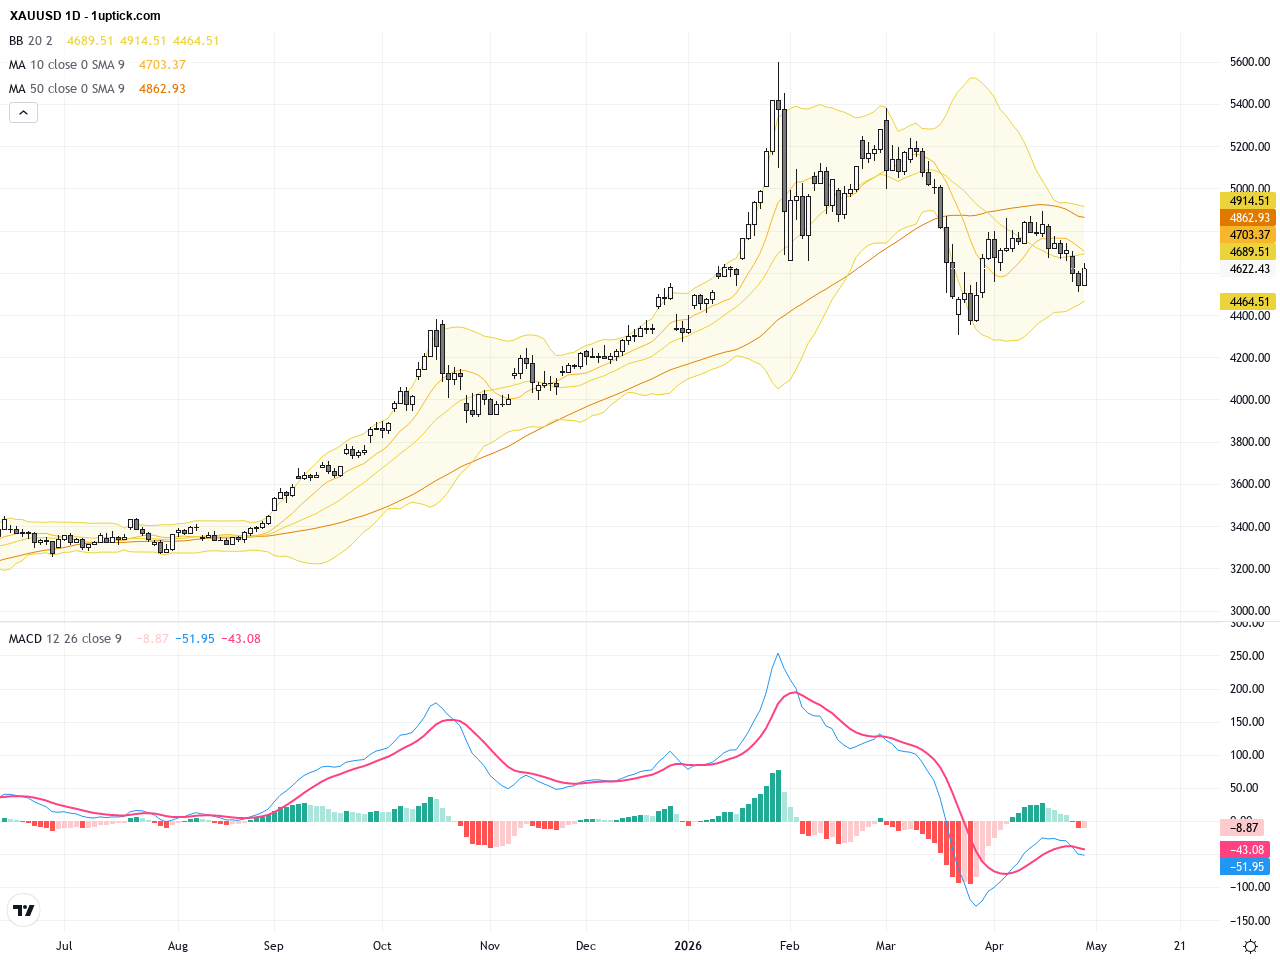
XAUUSD Insight: Dollar Strength Suppresses Gold with a Key Technical Pattern Warning, May 1, 2026

Over the past three trading days, XAUUSD experienced notable volatility driven by a stronger US dollar and the Federal Reserve’s signals of maintaining higher interest rates, closing yesterday at 4618.885. Market sentiment was mainly influenced by news highlighting the pressure on gold due to Fed stance and a robust dollar, which dampened hopes for a gold breakout. For the average investor, this translates to a temporary dip in safe-haven demand as gold prices remain highly sensitive to US monetary policy and dollar fluctuations. The main question now becomes whether a softer dollar can trigger a short-term gold rebound or if rising oil prices and inflation fears will continue to weigh on XAUUSD’s outlook this week.

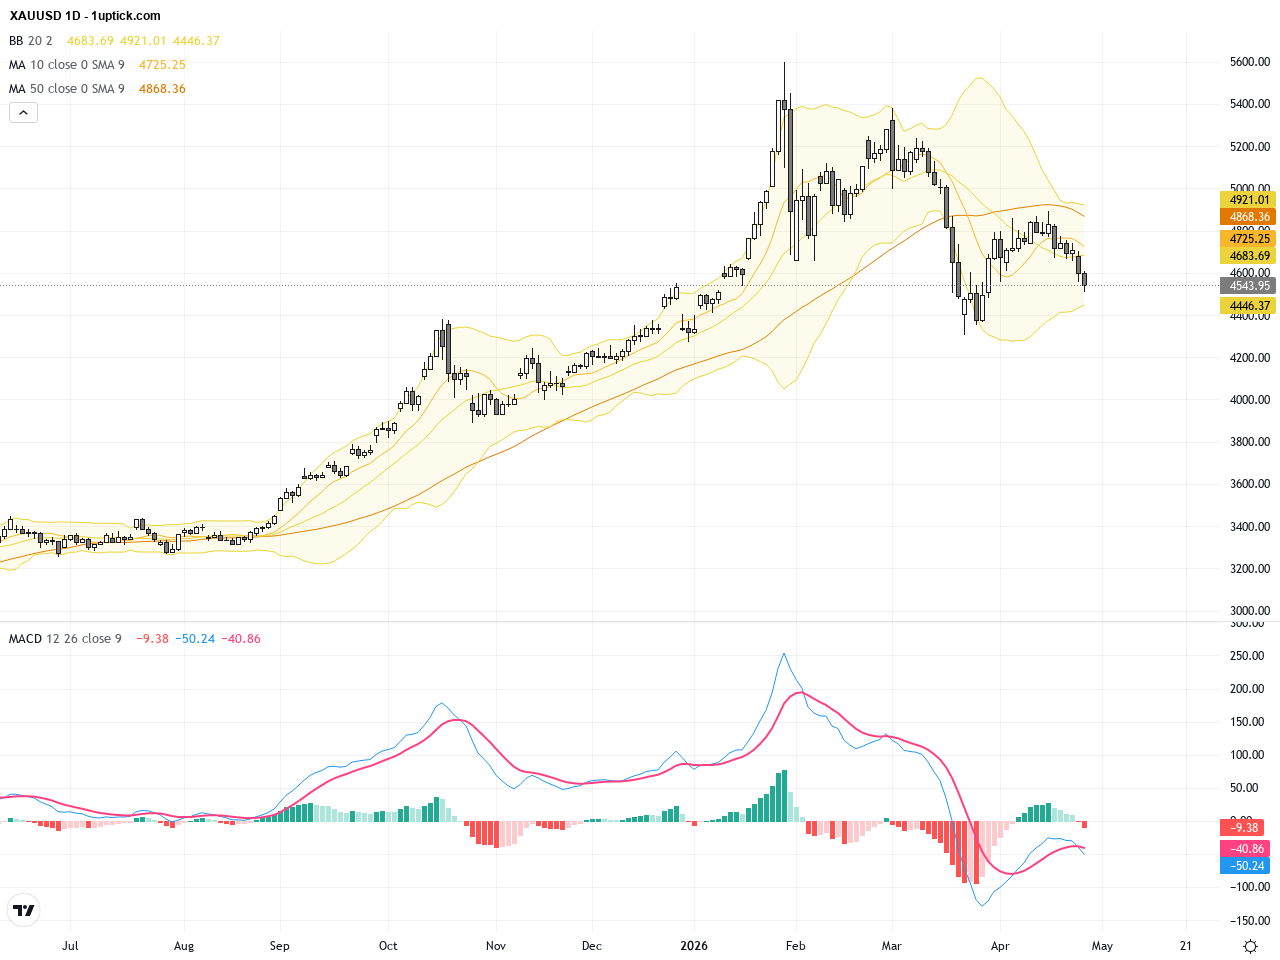
XAUUSD: Gold Faces Technical Correction Amid Fed Rate Hike Pressure

Over the past three trading days, XAUUSD has experienced significant downside pressure, dropping from a high of 4681.96 on April 27 to a close of 4542.13 yesterday, marking a 3% decline. The market mood shifted due to the Federal Reserve’s signaling of a ‘higher-for-longer’ interest rate policy, which bolstered the US dollar and pushed bond yields to 4.402%, reducing gold’s safe-haven appeal. Rising oil prices further fueled inflation concerns, pressuring gold prices. For the average investor, this means caution is warranted as gold enters a short-term correction phase. Technically, the price is approaching key support levels and without positive catalysts, the downward momentum may continue.

XAUUSD: Gold Faces Critical Test Amid Fed Rate Signals and Oil-Driven Inflation Pressure

Over the past three trading days, XAUUSD pulled back from around $4709 to close near $4680, reflecting rising market concerns over the Federal Reserve’s ‘higher-for-longer’ rate stance. With oil prices climbing back above $100 per barrel, volatility in safe-haven demand for gold has increased amid inflation and geopolitical uncertainties. Investors should closely watch Fed communications, oil price developments, and Middle East tensions, as these key factors will shape XAUUSD’s short to medium-term trajectory. For the average investor, the market mood is cautious and unsettled, urging careful risk management amid an unclear interest rate outlook.

XAUUSD: Key Technical Support Under Pressure as Strong Dollar and Oil Surge Weigh on Gold Outlook

Over the past three trading days, XAUUSD declined from 4740.46 to a yesterday’s close of 4690.92, signaling increasing selling pressure. A strong US dollar combined with oil prices climbing above $100 has heightened inflation concerns and delayed expectations of Fed rate cuts, weighing heavily on gold prices. For the average investor, this means the traditional safe-haven asset gold faces short-term headwinds. Market participants should monitor the interplay between the dollar strength and energy market dynamics closely. Overall, XAUUSD is amid a confluence of technical and fundamental pressures, prompting elevated short-term volatility and necessitating focus on critical price levels.

XAUUSD: Gold Price Stalls Below 50-Day MA as Key Support and Resistance Levels Guide Trading Outlook

Over the past three trading days, XAUUSD has shown notable volatility, retreating nearly 2% from a high of 4820 USD on April 20 to close at 4738 USD yesterday. The gold price’s recent struggle is influenced by a stronger US dollar and renewed Middle East tensions. Despite a temporary ceasefire boosting safe-haven demand, hawkish Fed rhetoric limits any sustained breakout above key moving averages. For the average investor, this means gold may remain range-bound short-term, with support and resistance levels playing a crucial role in price direction. Paying close attention to USD movements and geopolitical developments remains essential for analyzing XAUUSD’s near-term outlook.

XAUUSD: Gold Price Faces Resistance Below 50-Day Moving Average Amid Dollar Strength

Over the past three trading days, XAUUSD (Gold) has exhibited significant volatility, closing at 4818.33 USD on April 20, 2026. The price faced downward pressure from a stronger US dollar and rising tensions between the US and Iran, testing key support levels. Despite the short-term pullback, long-term macro fundamentals supporting gold remain intact. For the average investor, this means staying watchful of dollar movements and geopolitical risks that directly influence gold prices. Current XAUUSD price analysis suggests cautious trading, waiting for technical confirmations before committing to directional positions.

1uptick Analytics @

Risk Warning​

*Investment involves risk. You may use the information, strategies and trading signals on this website for academic and reference purposes at your own discretion. 1uptick cannot and does not guarantee that any current or future buy or sell comments and messages posted on this website/app will be profitable. Past performance is not necessarily indicative of future performance. It is impossible for 1uptick to make such guarantees and users should not make such assumptions. Readers should seek independent professional advice before executing a transaction. 1uptick will not solicit any subscribers or visitors to execute any transactions, and you are responsible for all executed transactions.

© 2022-26 1uptick Analytics all rights reserved.


Risk Warning​

*Investment involves risk. You may use the information, strategies and trading signals on this website for academic and reference purposes at your own discretion. 1uptick cannot and does not guarantee that any current or future buy or sell comments and messages posted on this website/app will be profitable. Past performance is not necessarily indicative of future performance. It is impossible for 1uptick to make such guarantees and users should not make such assumptions. Readers should seek independent professional advice before executing a transaction. 1uptick will not solicit any subscribers or visitors to execute any transactions, and you are responsible for all executed transactions.

© 1uptick Analytics all rights reserved.

Home
.AI
Analysis
Calendar
Tools