2025-04-22 @ 12:08
Gold Prices Hit Record High Amid Weaker Dollar and Rising Global Tensions
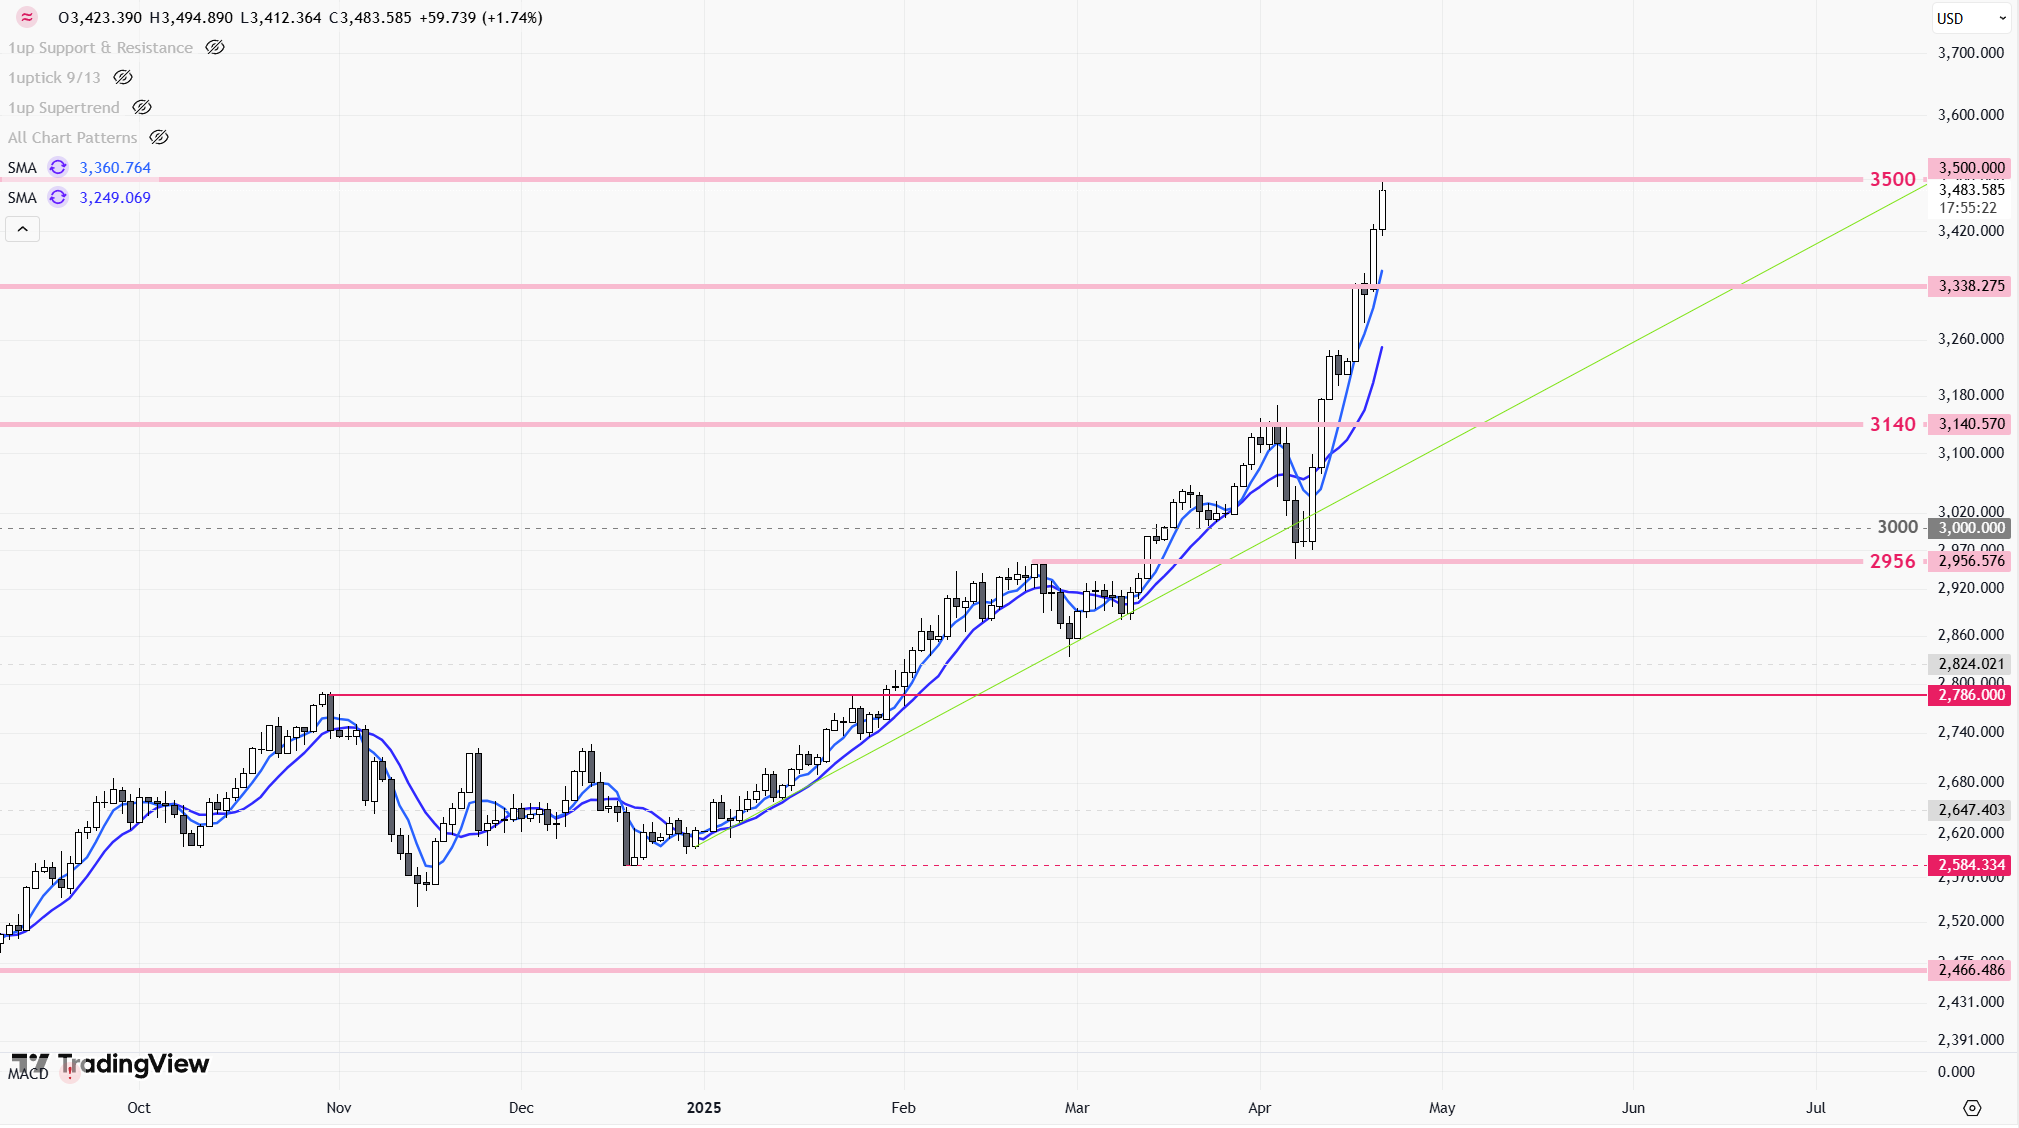
Spot gold surged to an all-time high of $3,473.10 in the past 24 hours, driven by a weakening U.S. dollar, escalating U.S.-China trade tensions, and a surge in safe-haven demand. The technical indicators point to a strong bullish trend, with clear short-term support and resistance levels.
Investors are closely watching upcoming U.S. retail sales data and potential countermeasures from China, both of which could impact market sentiment. With strong momentum in play, gold prices may continue rising in the near term.
Staying updated with real-time gold price movements and recognizing key trend reversals are essential strategies for effective gold trading.
2025-04-22 @ 11:48
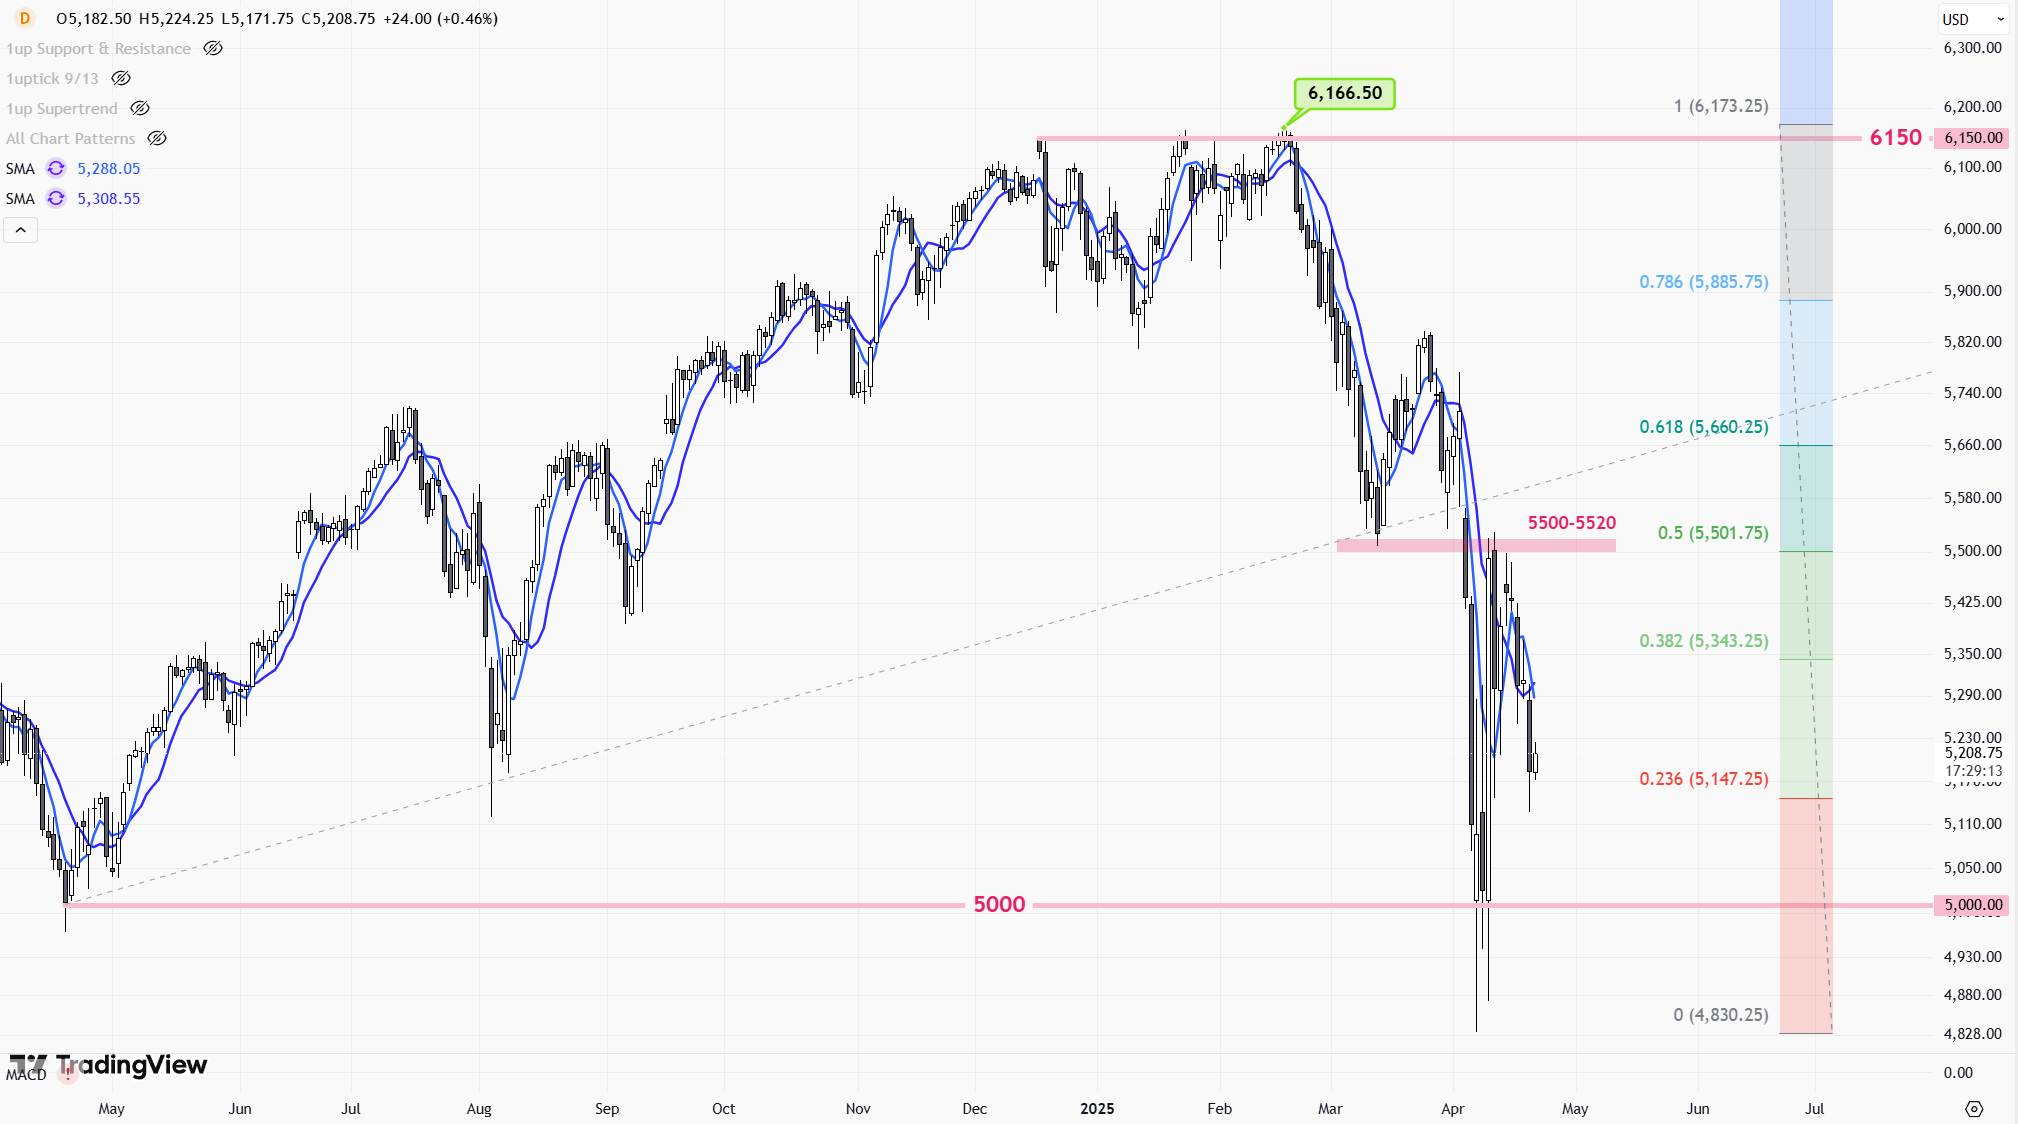
On April 21, 2025, U.S. stocks saw a broad selloff triggered by rising geopolitical tensions and renewed trade uncertainties. All three major indices closed sharply lower, with the S&P 500 recording its biggest single-day drop in nearly two weeks. Technology shares led the decline, while comments from former President Donald Trump rattled investor confidence, intensifying risk-off sentiment across the market.
In this article, we break down the latest market movements, key policy factors influencing investor behavior, and provide actionable investment strategies to navigate increased volatility. Discover what’s driving the current downturn and how to position your portfolio amid evolving global risks.
2025-04-20 @ 14:26
In 2025, the U.S. implements an unprecedented “reciprocal tariff” policy, imposing steep import duties on key trading partners like China and the European Union. Chinese goods face tariffs as high as 145%. The bold move sends shockwaves through global markets, driving up corporate costs, disrupting supply chains, and forcing a downward revision of global economic forecasts. U.S. stocks plunge, inflation surges, and the structure of international trade faces a dramatic shift. Multinational corporations and national governments are now scrambling to adapt, signaling a new era for global commerce.
2025-04-17 @ 13:18
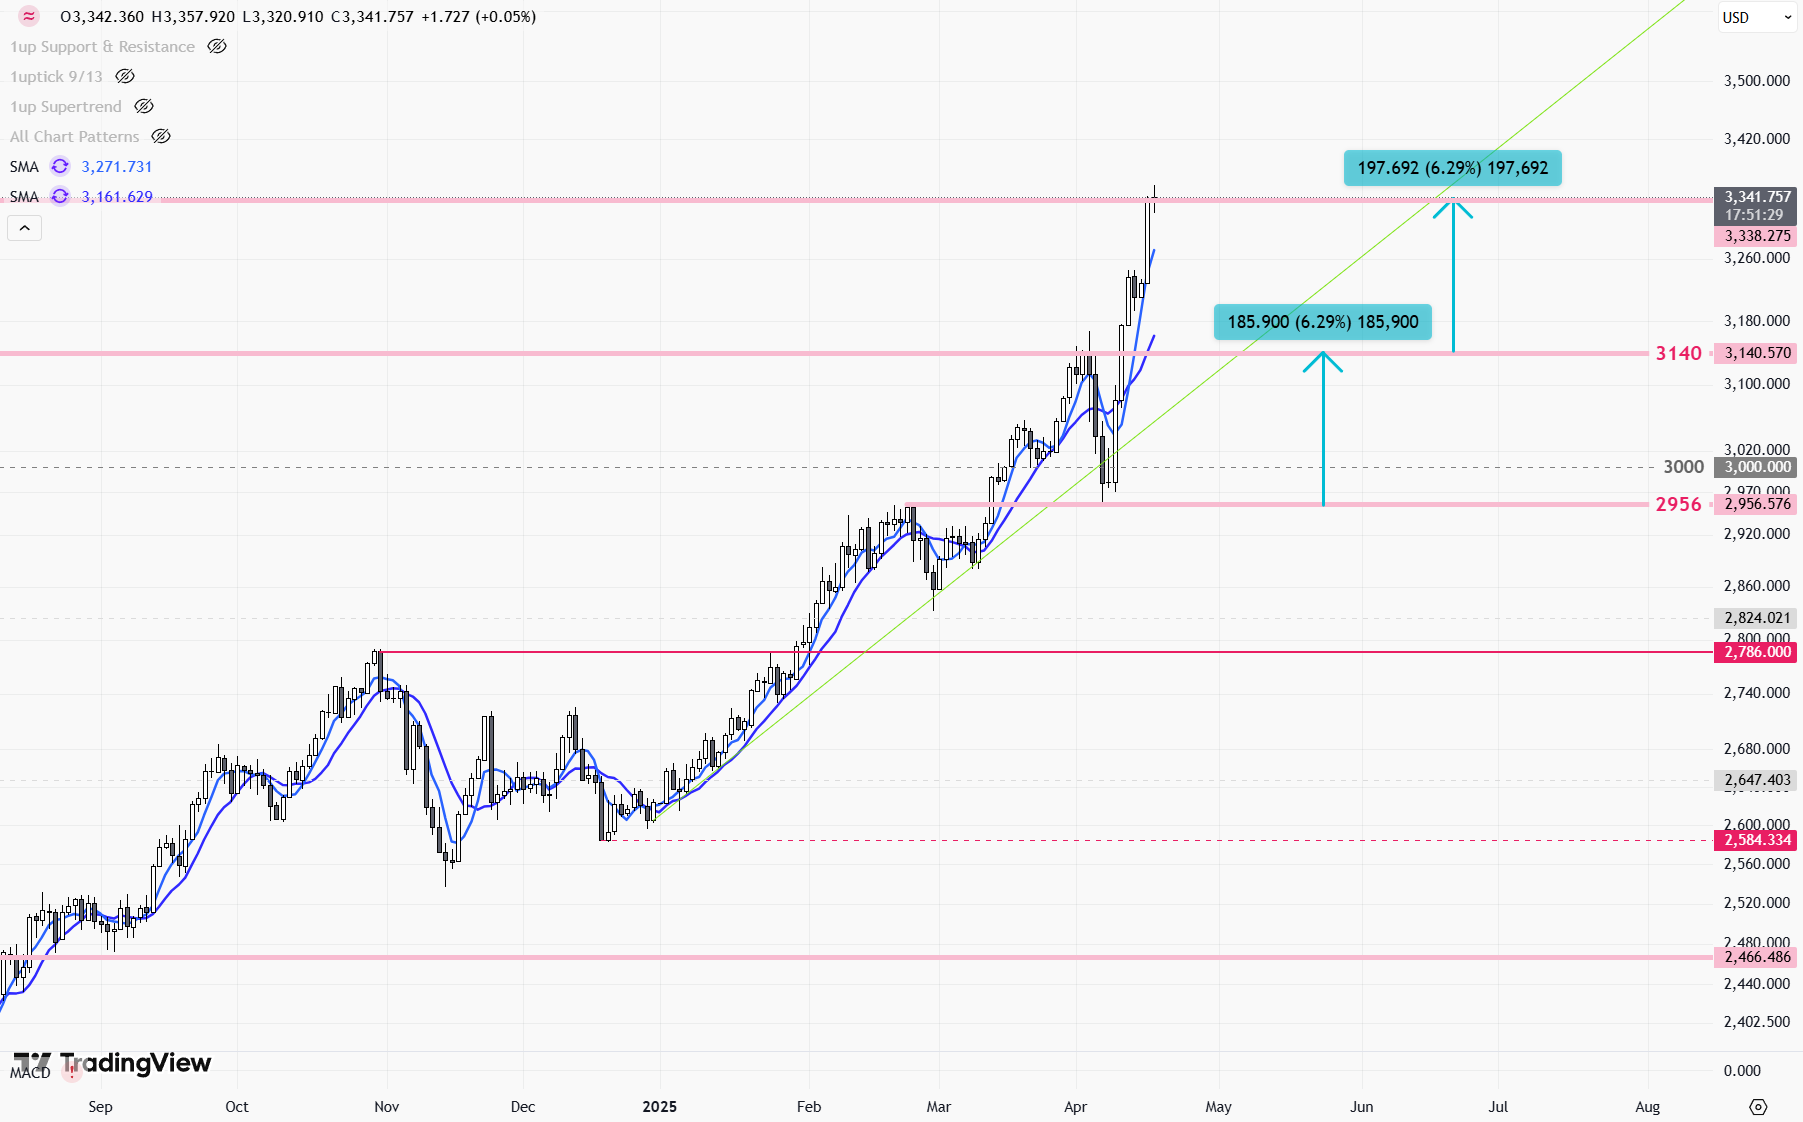
Spot gold has seen sharp swings over the past 24 hours, briefly reaching a record high as weak U.S. economic data and rising geopolitical tensions boosted safe-haven demand. Technical indicators suggest that bullish momentum remains intact, with $3,340 emerging as a key support level. As investors turn their focus to U.S. jobless claims and the Federal Reserve’s next move, gold’s short-term price action is drawing heightened attention. Stay ahead of the market with the latest gold price analysis and identify timely investment opportunities.
2025-04-16 @ 15:49
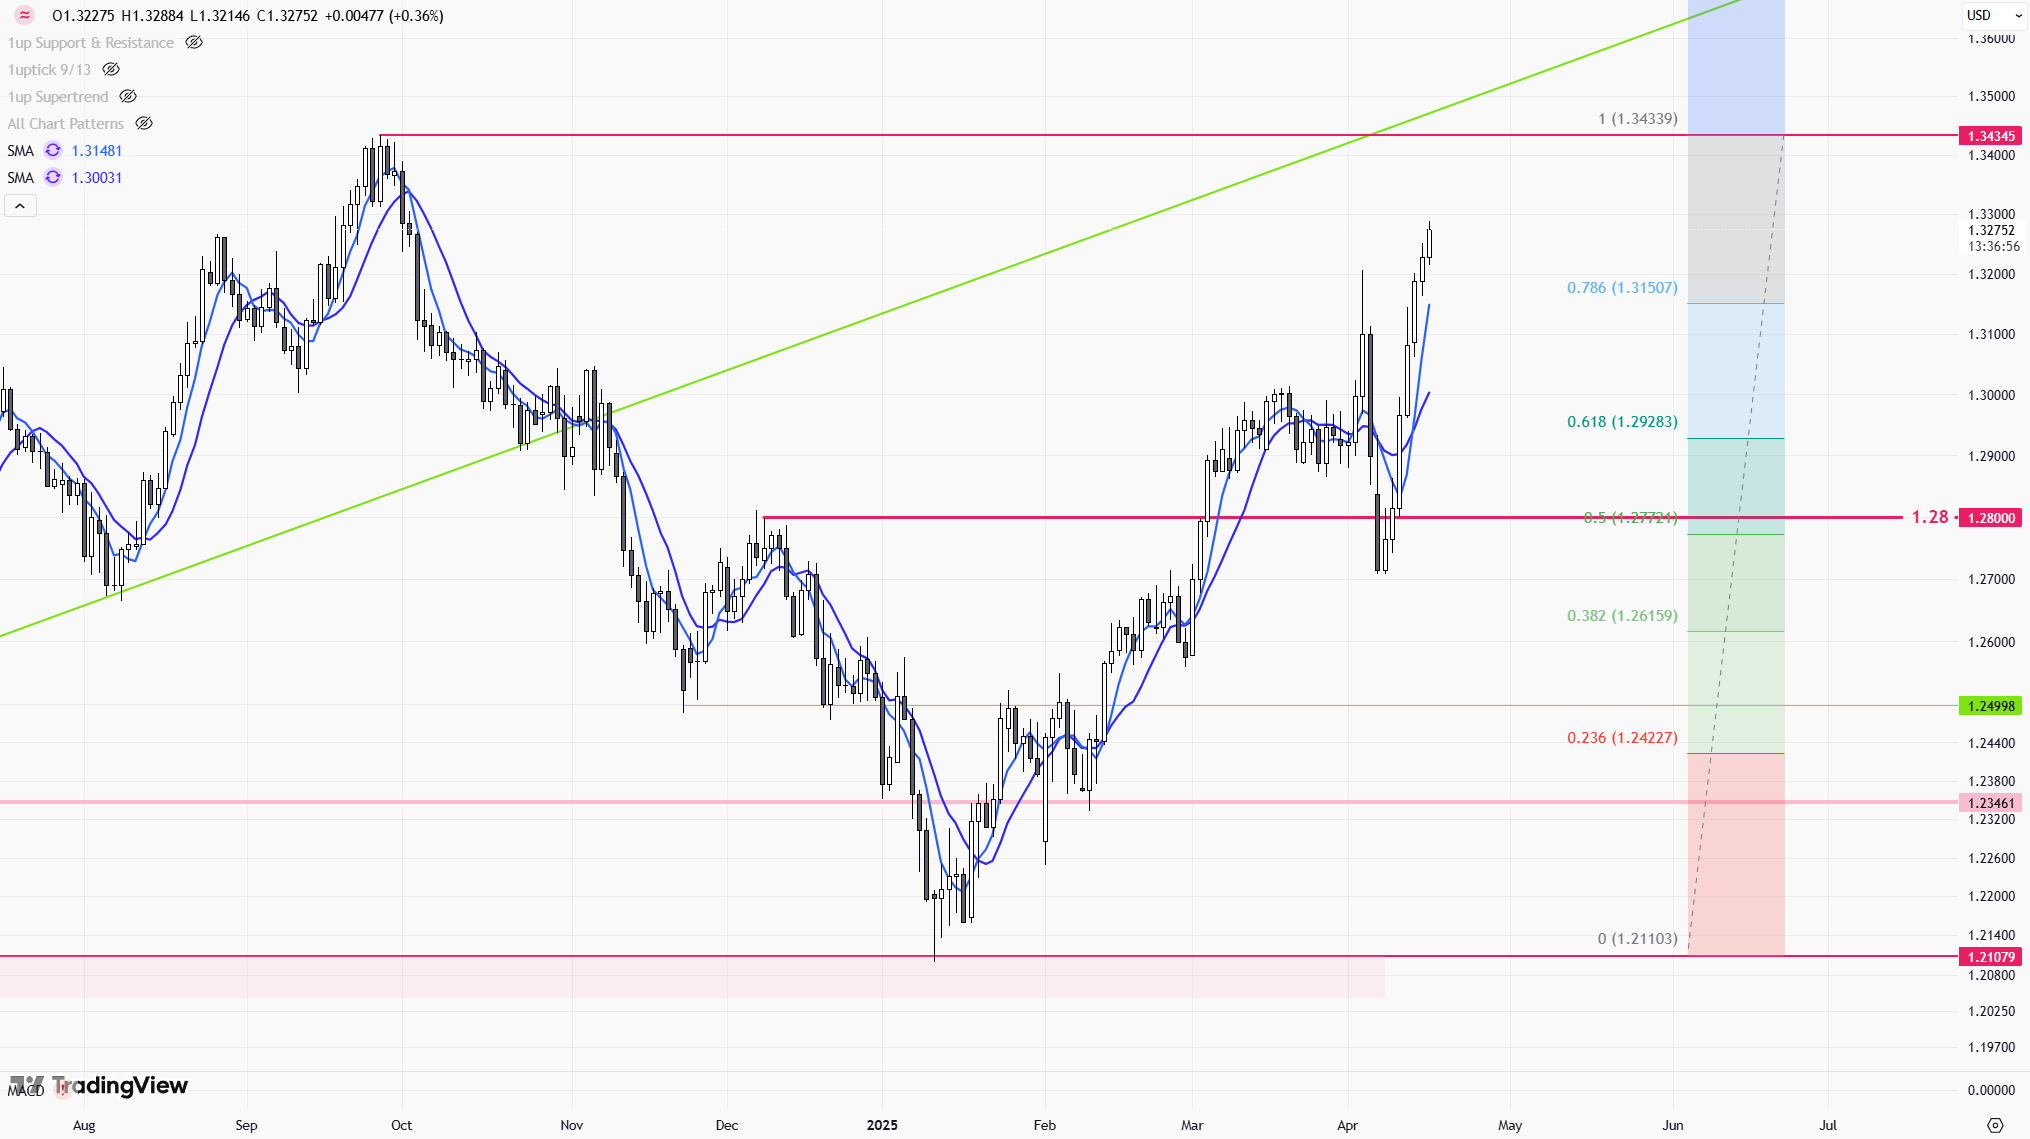
The British pound continues its upward momentum against the US dollar, driven by diverging monetary policies between the UK and the US, as well as ongoing dollar weakness. This has pushed GBP/USD to a nearly six-month high. From a technical perspective, the pair remains in a bullish trend, with short-term potential to test the 1.3300 level. As markets turn their attention to upcoming US retail sales data and UK unemployment figures, the outlook for GBP/USD warrants close monitoring. Forex traders may consider buying on dips while maintaining strict risk management to capitalize on potential gains in the pound’s strength.
2025-03-12 @ 11:23
Price Movement The chart provided showcases a recent decline in the Nasdaq index, following a significant uptrend observed in the latter half of the previous year. Initially, the index displayed bullish momentum, characterized by higher highs and higher lows, indicating strong buying interest. However, a recent downturn began in the first quarter of 2025, with […]
2025-03-12 @ 10:29
Price Movement The Dow’s daily candlestick chart demonstrates a significant downward trajectory, breaking below previously established support levels. The price movement in recent months has transitioned from a period of consolidation to a notable bearish decline. Initially, the Dow was trading within an upward channel, constrained by slightly inclining trendlines. This period reflected a gradual […]
2025-03-05 @ 11:22
Price Movement The daily chart of the S&P depicts a fluctuating trend with periods of both bullish and bearish sentiment. Initially, there is a significant uptrend, indicated by a series of higher highs and higher lows, sustaining above the green upward channel. As the chart progresses, the price encounters resistance around the 45,180 level, subsequently […]
2025-03-04 @ 17:23
Price Movement The EUR/USD daily chart shows prolonged bearish movement followed by a consolidation period. Initially, the pair experienced a significant downward trend as indicated by consecutive lower lows and lower highs. A reversal was attempted, but resistance around the 1.0500-1.0530 range halted further upward movement. Throughout the period under consideration, the price oscillated within […]
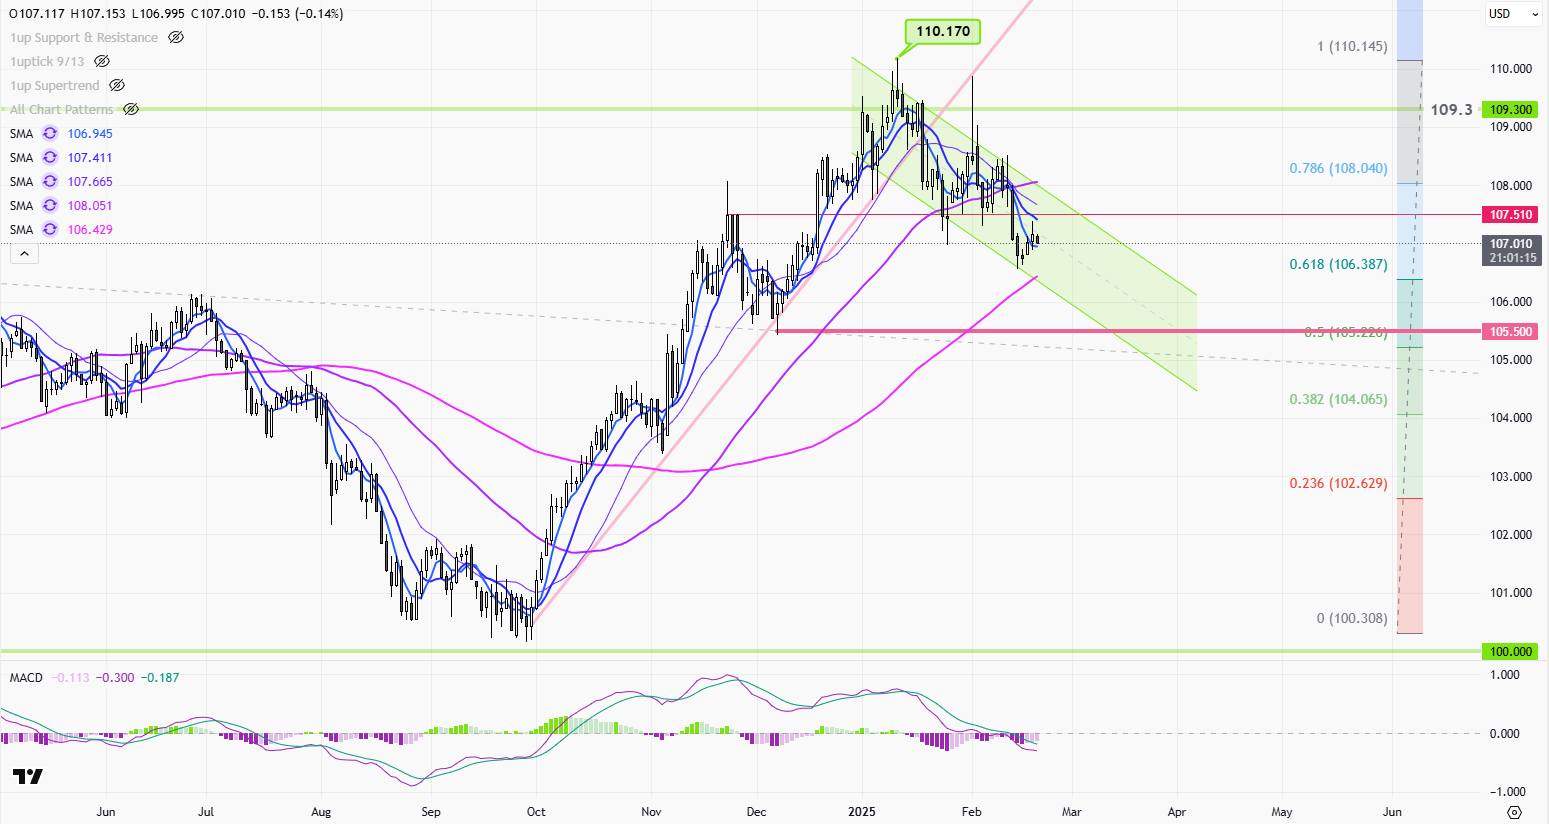
2025-02-23 @ 15:52
Price Movement The USD Index daily chart shows a recent period of volatility with notable price shifts. Initially, the index experienced an upward trend, reaching a peak near 110.170. This rise was followed by a pullback, as sellers gained control, leading to increased bearish sentiment. The chart indicates a series of lower highs and lower […]