


 |
| Gold V.1.3.1 signal Telegram Channel (English) |


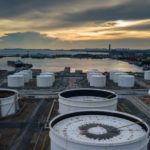
The UAE Just Rage-Quit OPEC, and the Oil Market Barely Flinched
The UAE’s exit from OPEC is being sold as a supply earthquake. The market treated it more like a coworker’s farewell email—acknowledged, then immediately forgotten. Here’s why the real story is weirder, scarier, and funnier than the headline.
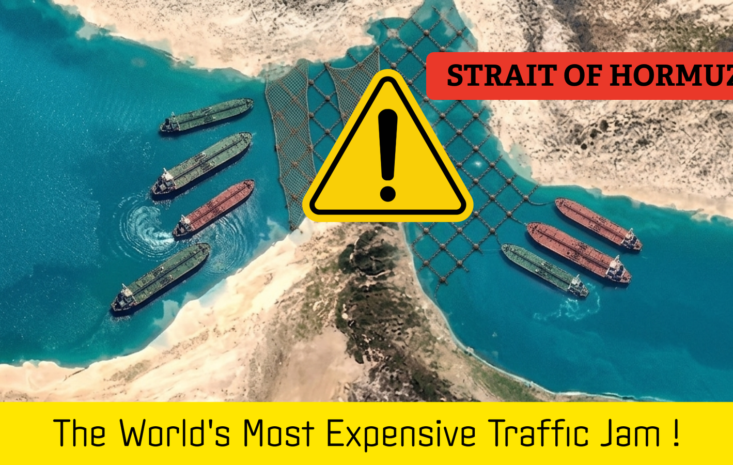
The World’s Most Expensive Traffic Jam: How One Narrow Strait Broke Everything From Your Gas Tank to Your GPU
Iran closed the Strait of Hormuz and oil doubled. But the real story isn’t crude—it’s the helium you’ve never thought about that’s about to make your next laptop cost more than your car payment.

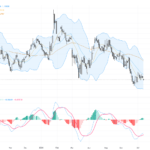
Technical Analysis of the Financial Markets: The XYZ Framework for Strategic Mastery in 2026
Explore the XYZ Framework for technical analysis of the financial markets in 2026. Master assessment, execution, and optimization with professional insights and market intelligence.

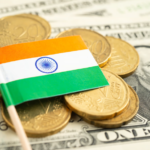
Beginner’s Roadmap to Investment and Wealth Management in 2026
Investment in 2026 is not just about money—it’s about navigating a dynamic market shaped by innovation and global shifts. This guide breaks down your first year into manageable milestones, balancing enthusiasm with caution for solid financial growth.
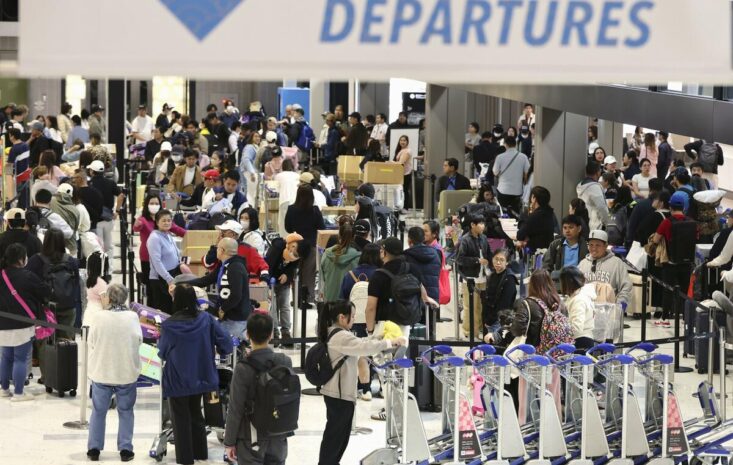
Weak Yen Triggers Japan’s First Post-COVID Summer Outbound Travel Drop in 2026
Japan’s outbound travel during summer 2026 is set to drop 8.8%, the first decline since the pandemic recovery began. A weak yen and rising travel costs are hitting both overseas and domestic trips, posing fresh challenges to airlines and tour operators.

Japan’s Tourism Boom Reveals Sharp Labor Shortage in Accommodation Sector
As inbound tourism surges back in Japan, more than 70% of accommodation providers report serious labor shortages. Low wages, tough work conditions, and minimal days off are driving the crisis, prompting a push toward automation and consolidation in the sector.
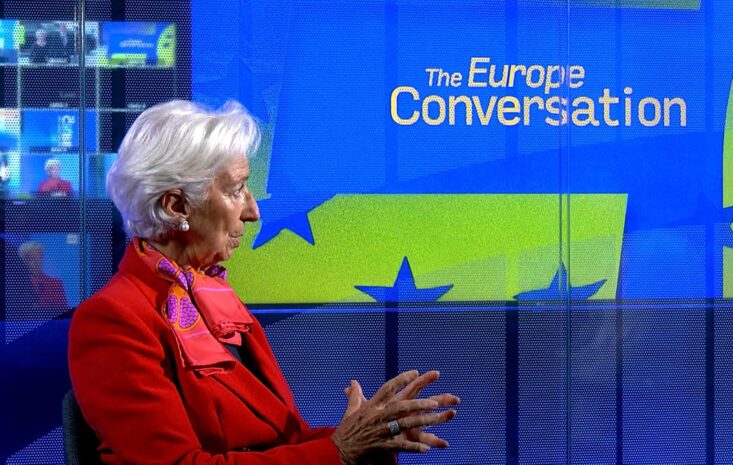
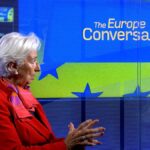
Europe’s Safe Asset Debate Heats Up as ECB Backs Joint Borrowing Talks
ECB President Christine Lagarde has signaled a fresh push to create a ‘safe, liquid European asset,’ supporting Spain’s call for joint borrowing. This marks a pivotal moment for eurozone fiscal integration and the euro’s global standing.
